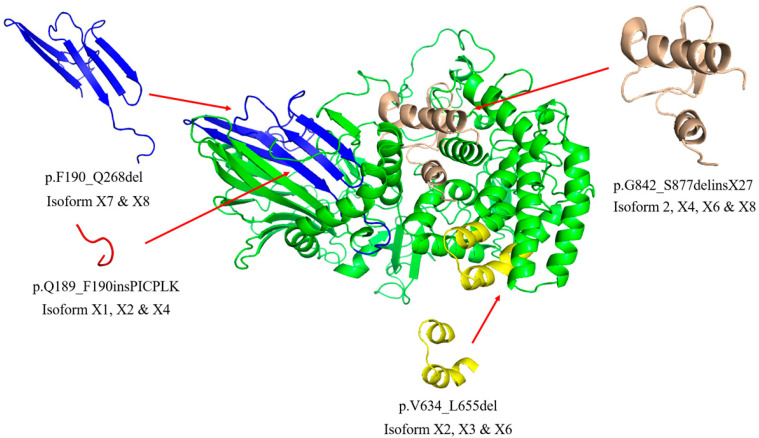
Figure 2.
Structural model of human GBA2 highlighting the structures changed by deletions and insertions in the splicing isoforms relative to isoform 1. All structural variations are labeled relative to the human GBA2 isoform 1 reference sequence NCBI: NP_001317589.1. The homology models were generated based on the structure of TxGH116 (PDB: 5BVU) [30] with SWISS-MODEL [31]. The cartoon model of GBA2 isoform 1 (NCBI: NP_001317589.1) is shown in green with deletions shown in various colors with the deleted structures shown in the corresponding color to the side with the list of isoforms containing this variation. The insertion p.Q189_F190insPICPLK predicted structure (red) is positioned based on the isoform X1 model. Individual homology models are shown in SI Figure S1.

