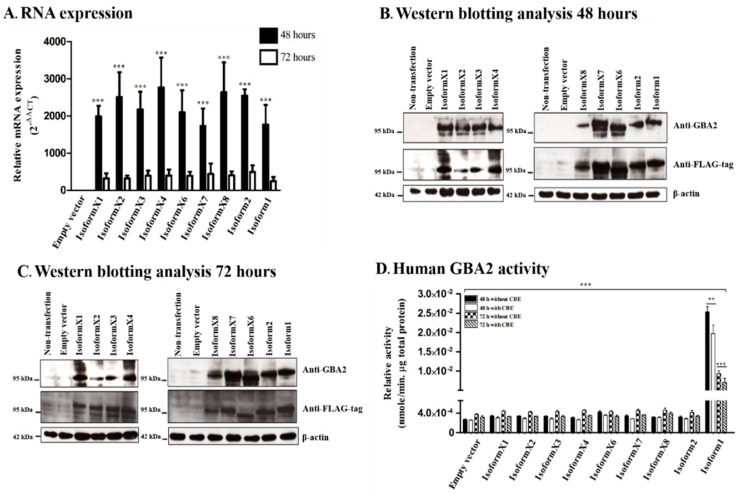
Figure 3.
Expression of human GBA2 RNA, protein and activity in COS-7 cells transfected with human GBA2 isoforms. (A) RNA expression levels of hGBA2 compared between 48 and 72 h conditions as well as to empty vector control at 48 h; (B,C) Western blot analysis with different incubation times, 48 and 72 h, using anti-GBA2 and anti-FLAG-tag antibody; (D) activity determination of hGBA2 compared between 48 and 72 h as well as between with and without inclusion of CBE. All experiments were done with three independent biological replicates, and means and standard deviations are shown in A and D with * indicating differences with p < 0.05, ** indicating p < 0.01, *** indicating p < 0.001 in a two-tailed unpaired t-test and ANOVA with Tukey’s multiple comparison for different time points. Shapiro–Wilk analysis showed no significant deviance from a normal distribution. For Western blots (B,C), the most clear example from the three similar replicates of independent biological samples is shown.

