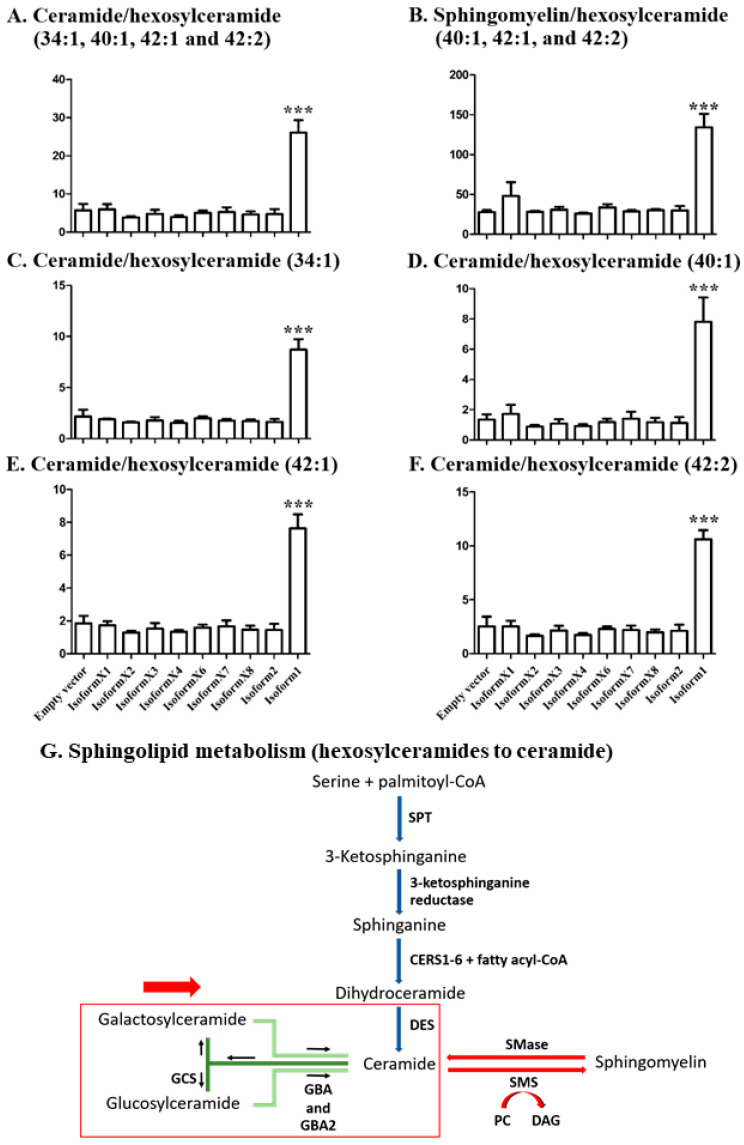
Figure 5.
Effect of GBA2 isoforms on ceramide/hexosylceramide peak intensity ratios of specific ceramide species. (A) Ceramide/hexosylceramide (34:1, 40:1, 42:1, and 42:2), (B) sphingolyelin/hexosylceramide (40:1, 42:1, and 42:2) and ceramide/hexosylceramide ratios for 34:1, 40:1, 42:1, and 42:2 are shown separately in (C–F), respectively. Data are expressed as mean of three independent biological replicates ± SD, *** p < 0.01 significance for the difference from empty vector control in the unpaired t-test. Shapiro–Wilk analysis showed no significant deviance from a normal distribution for the samples with significant differences. (G) Map of sphingolipid metabolism showing hexosylceramide hydrolysis to release ceramides and their subsequent conversion to other species, which is affected by GBA2 overexpression.

