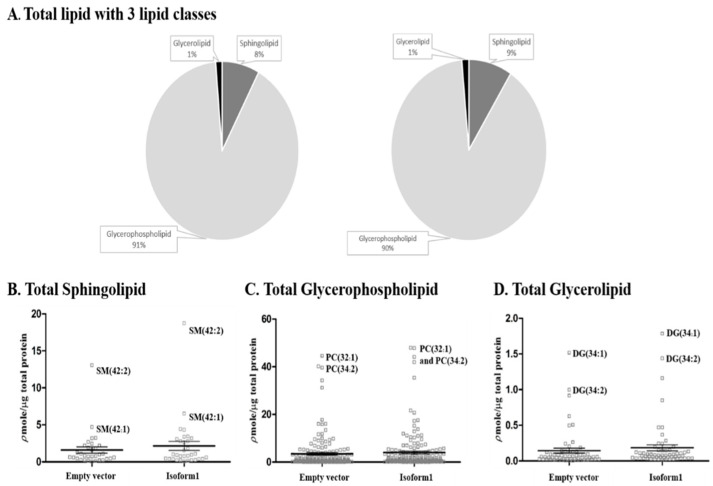
Figure 6.
Relative levels of sphingolipids, glycerophospholipids, and glycerolipids in COS-7 cells transfected with empty vector and vector for human GBA2 isoform 1 for 48 h. (A) Relative amounts of three classes of lipid species. Levels of specific sphingolipid (B), glycerophospholipid (C), and glycerolipid (D) species and average values in control and cells expressing GBA2 isoform 1 are illustrated as parallel dot plots. Amounts were determined by mass spectrometry analysis of COS-7 cell lipid extracts. Results are representative of three independent replicates.

