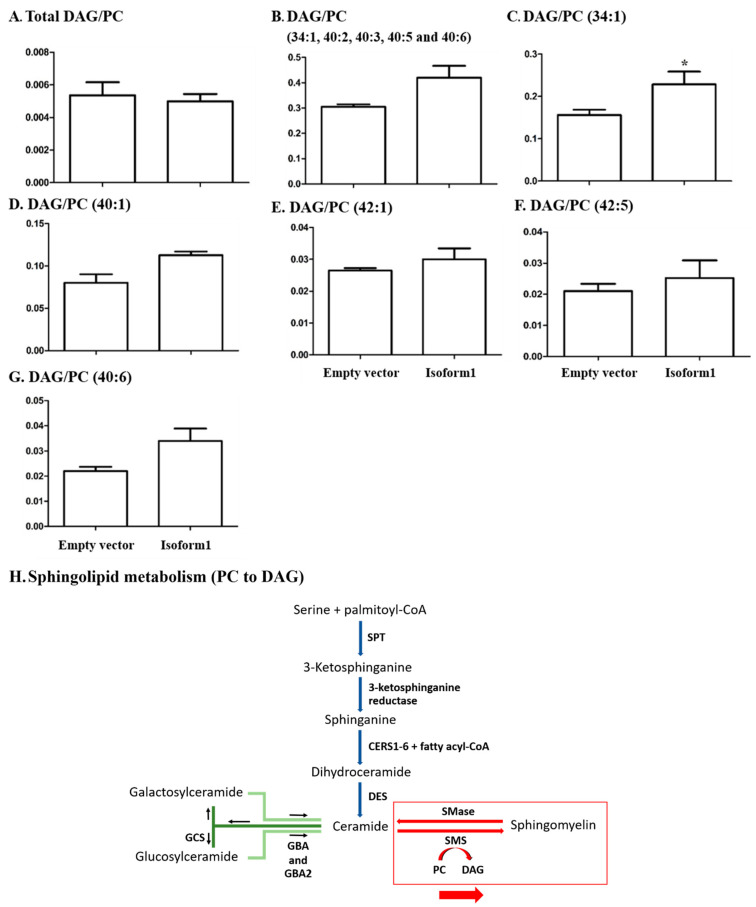
Figure 7.
Ratios of levels of diacylglycerol to phosphatidylcholine in COS-7 cells transfected with control vector and GBA2 isoform 1 expression vector for 48 h. The ratios of total diacylglycerol (DAG) to total phosphatidylcholine (PC) are shown in (A). Total DAG/PC for those lipid species found in both lipid classes 34:1, 40:2, 40:3, 40:5, and d40:6) are shown in (B). The individual DAG/PC ratios for 34:1, 40:1, 42:1, and 42:2 are shown in (C–G), respectively. Data are expressed as mean of three independent biological replicates ± SD, * indicates p < 0.05 in the unpaired t-test. The distributions of sample values for all conditions did not deviate significantly from a normal distribution in a Shapiro–Wilk test. (H) Sphingolipid metabolism showing conversion of ceramide to sphingomyelin, which is affected by GBA2 overexpression, with emphasis on the conversion of PC to DAG during SM synthesis.

