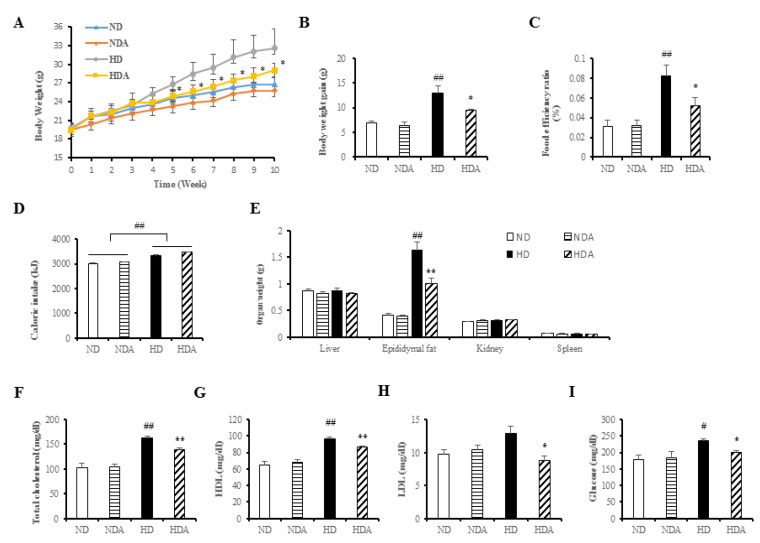
Figure 2.
Effect of L. sakei ADM14 on high-fat diet-induced obese mouse model and changes in biomarkers. (A) Weight change of experiment mice groups for 10 weeks. (B) Total weight gain for each group after 10 weeks. (C) Food efficiency ratio over 10 weeks for each group. (D) Total caloric intake over 10 weeks for each group. (E) Organ weights of mice in each group after sacrifice. (F) Serum total cholesterol concentration. (G) Serum HDL (high density lipoprotein) concentration. (H) Serum LDL (low density lipoprotein) concentration. (I) Serum fasting glucose concentration. Results are shown as mean ± SEM (n = 5). Significant differences between HD and ND groups are indicated as # p < 0.05, ## p < 0.01. Significant differences between HD and HDA groups are indicated as * p < 0.05, ** p < 0.01.

