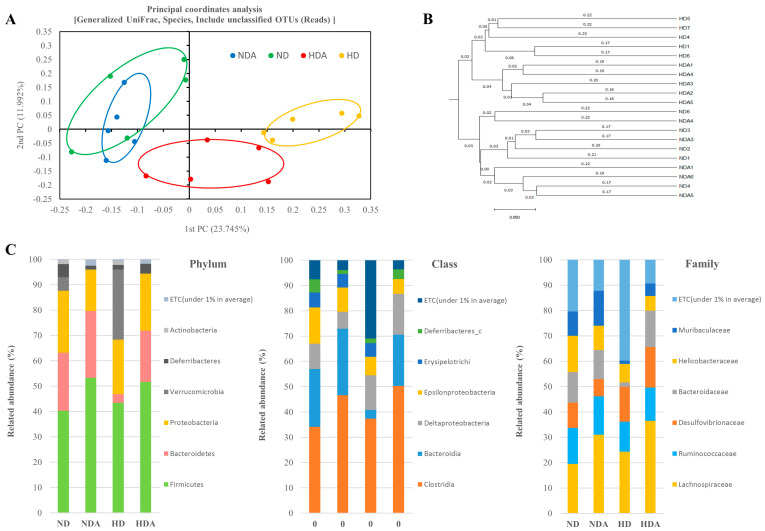
Figure 4.
Effect of L sakei ADM14 on taxonomic composition. (A) Cecal microbiota composition of groups is shown by generalized UniFrac principal coordinates analysis (PCoA). (B) Unweighted Pair Group Method with Arithmetic Mean (UPGMA) clustering. The distance calculated by generalized UniFrac. (C) The relative abundance of the cecal microbiota at the phylum, class, and family levels. n = 5 per group. The nonparametric Wilcoxon signed rank test for paired data and Mann–Whitney U test for unpaired data were used.

