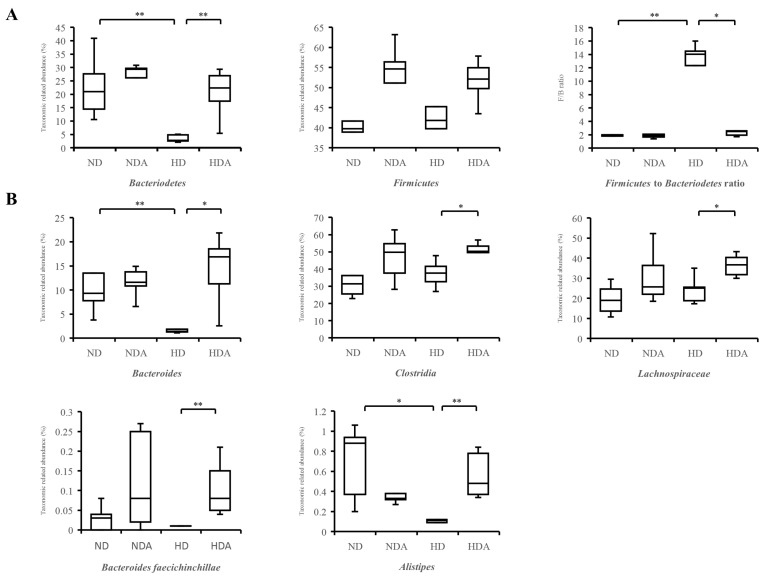
Figure 5.
The relative abundance of specific bacteria in the cecum. (A) Bacteroidetes, Firmicutes, and Firmicutes to Bacteroidetes ratio. (B) Specific bacteria of important taxa in the human gut. The nonparametric Wilcoxon signed rank test for paired data and Mann–Whitney U test for unpaired data were used. Significant differences are indicated as * p < 0.05, ** p < 0.01.

