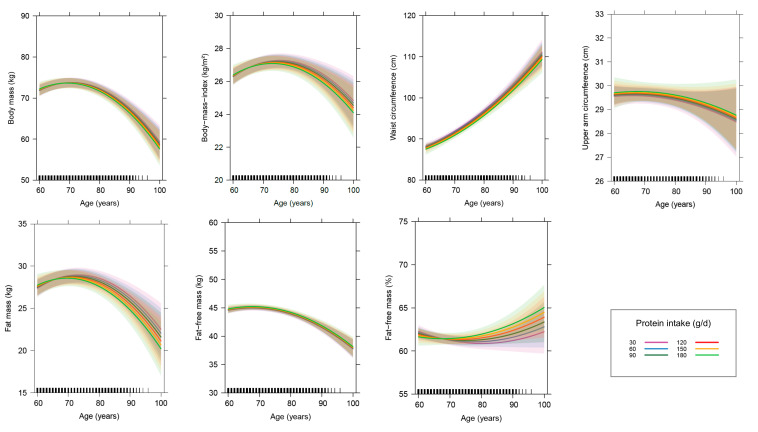
Figure 4.
Age-related changes in parameters of anthropometry and body composition in dependence of the daily protein intake. This figure displays the effect of age on parameters of anthropometry and body composition in dependence of the daily protein intake after controlling for other variables in the linear mixed-effects models (n = 401). The colored lines show the age-related changes in parameters of anthropometry and body composition at different dietary protein intake levels, ranging from 30 to 180 g/day. The thick lines represent the estimated means and the respective colored areas reflect the 95% confidence intervals. The small black pillars on the x-axis reflect the numbers of records at the respective age of the subjects.

