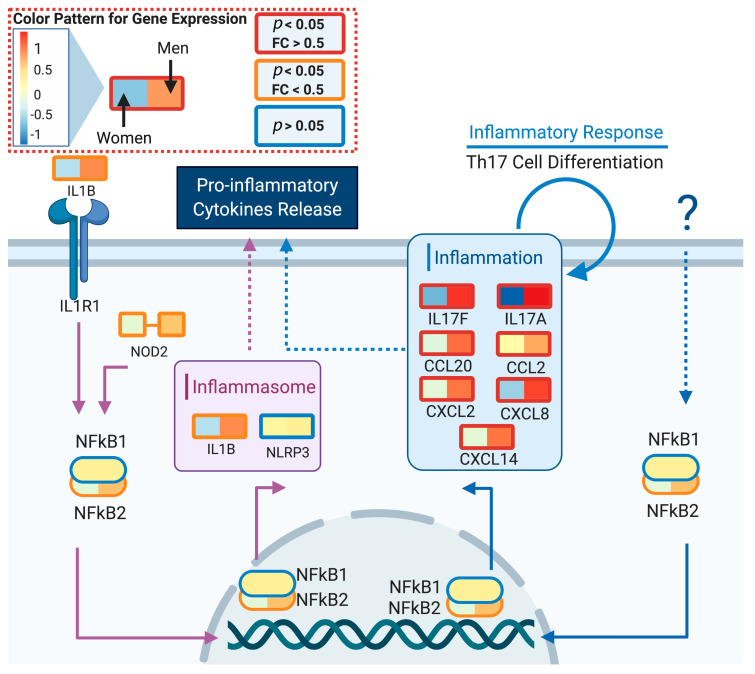
Figure 6.
Differential expression of spleen cytokine and chemokine genes between sex groups. Boxes represent the mean gene expression value for old women (left) and men (right) groups at spleen samples. Old is defined as >60 years old. Box line color indicates the significance level, red: p < 0.05 and fold change (FC) > 0.5; orange: p < 0.05 and FC > 0.5 and blue: p > 0.05 (not significant). The model indicates that males have higher basal levels of proinflammatory cytokines. Created with biorender.com.

