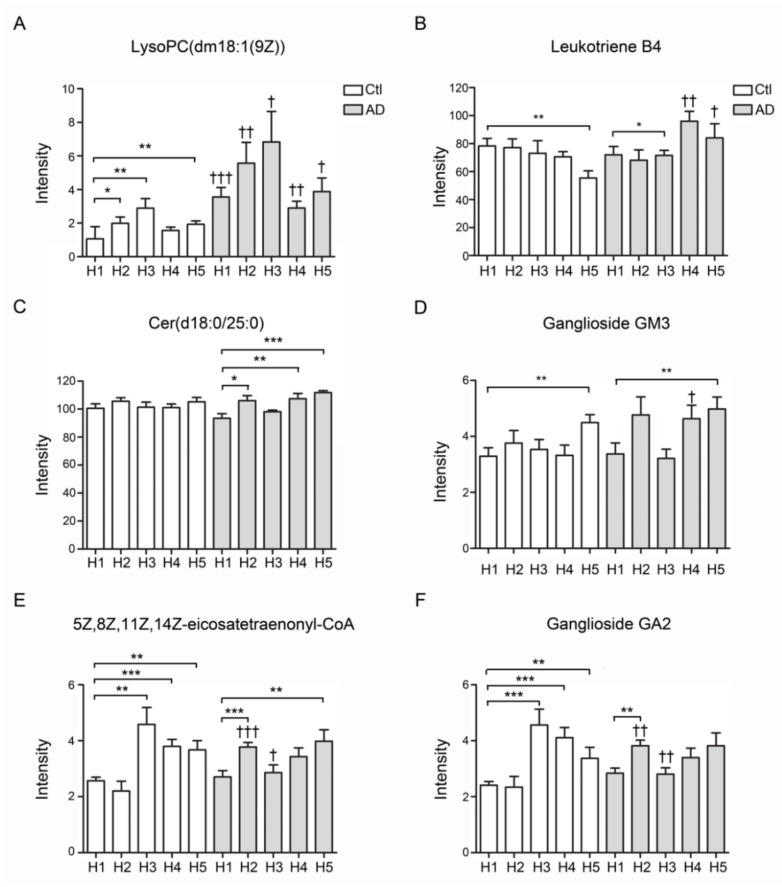
Figure 5.
Lipidomics analysis of HDL form AD patients and controls. (A) LPC (dm18:1(9Z)) was significantly increased in all subfractions of AD-HDL in comparison with Ctl-HDL. (B) Eukotriene was significantly decreased in the H5 of Ctl-HDL. (C) Cer(d18:0/25:0) ceramide was elevated in H4 and H5 of AD-HDL in comparison with H1. (D) Ganglioside GM3 was elevated in the H5 of AD-HDL and Ctl-HDL subfractions. (E) Eicosatetraenonyl-CoA was elevated in H3–H5 from Ctl-HDL and H2 and H5 from AD-HDL. (F) Ganglioside GA2 was enhanced in H3–H5 from Ctl-HDL and H2 and H5 from AD-HDL. * p < 0.05, ** p < 0.01, *** p < 0.001: comparison to H1 of either AD patients or controls; † p < 0.05, †† p < 0.01, ††† p < 0.001: comparison between AD patients and controls.

