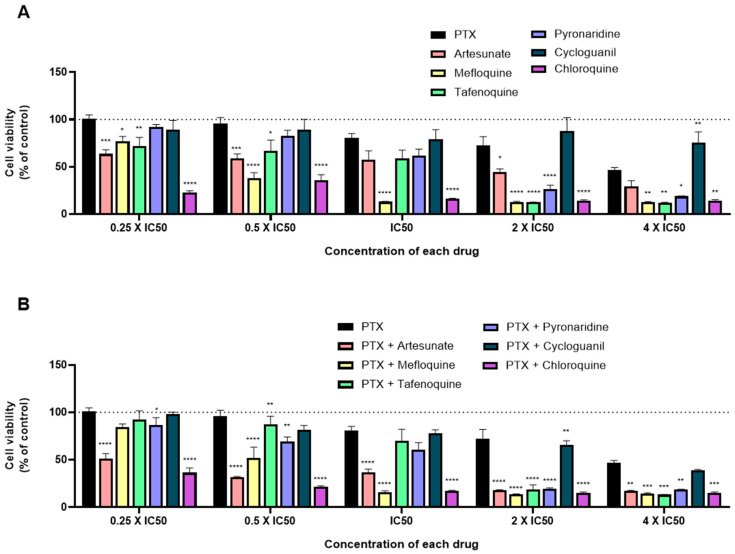
Figure 8.
Growth inhibition of MCF-7 cells after 48 h of single drug (A) and combination therapy (B) exposure. Cells were exposed to concentrations of each drug of 0.25, 0.5, 1, 2, and 4 times their IC50 and cell viability was evaluated by MTT assay. The drugs in combination were co-administered at the same time. Values are expressed in percentage in relation to PTX activity and represent means ± SEM. Each experiment was done three times independently (n = 3); * statistically significant vs. control at p < 0.05. ** statistically significant vs. control at p < 0.01. *** statistically significant vs. control at p < 0.001. **** statistically significant vs. control at p < 0.0001.

