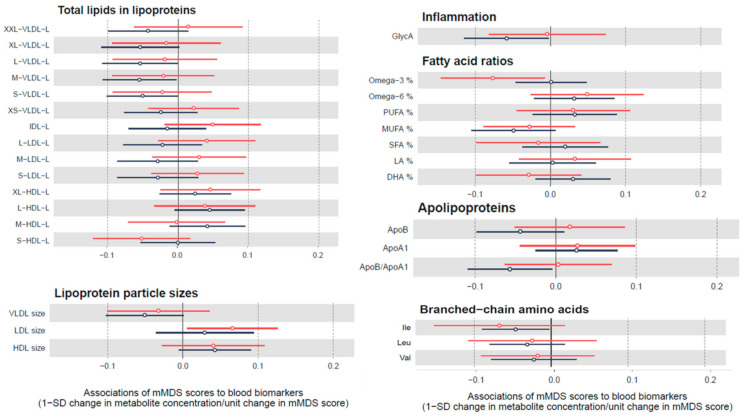
Figure 3.
Cross-sectional association between biomarkers and adherence to the MedDiet for all participants at time point 1 and time point 2. Red lines show the results for the participants at baseline and black lines for the participants at follow up. Results show changes by SD in each biomarker per unit change in mMDS score and are displayed by hollow points along with their 95% confidence intervals.

