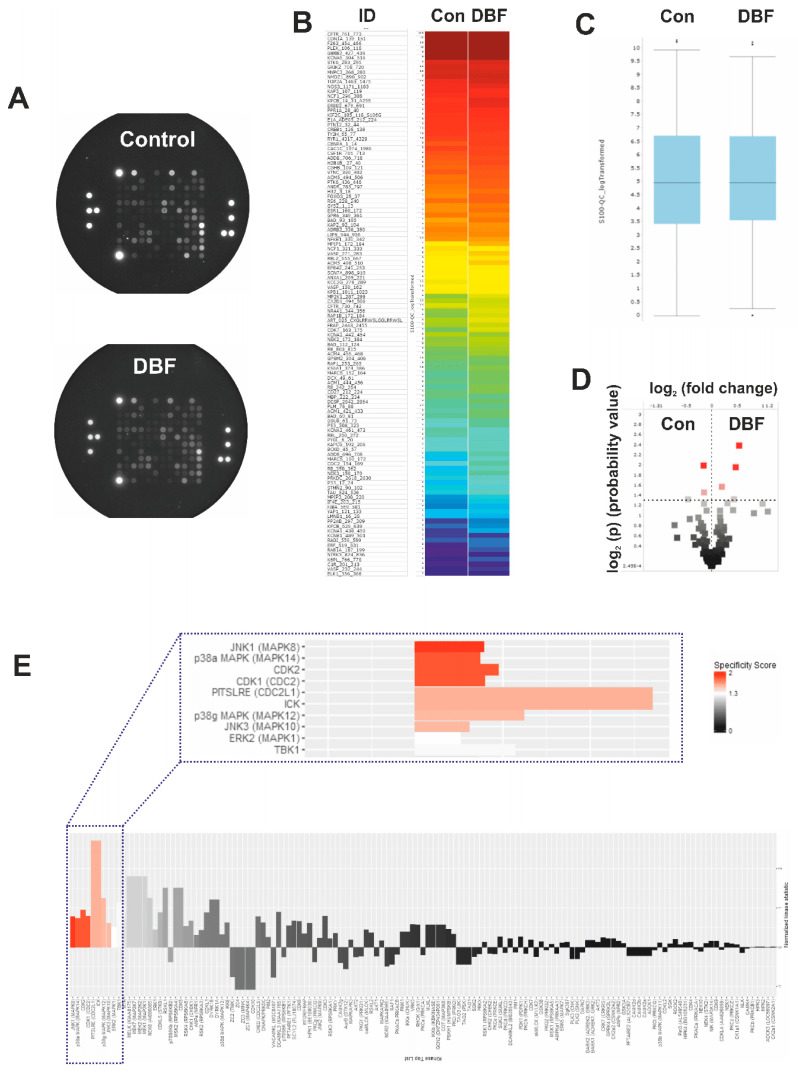
Figure 2.
Functional kinome profiling of serine/threonine kinases (STKs). 22Rv1 cells were treated with DBF for 2 h; proteins were extracted and analyzed using STK-PamChip® (sequence-specific peptide phosphorylation assay) and anti-phospho-STK antibodies. (A), Microphotographs of STK-PamChip®. The generated data is represented as heat-map plot (B), box plots (C), or volcano-plot (D). Red dots indicate peptide substrates having significantly increased phosphorylation in comparison to control samples (log2(p) > 1.3, dotted line, (D)). (E), Upstream analysis of the treatment-affected kinases in 22Rv1 cells. Normalized kinase statistic > 0 indicates higher kinase activity in DBF-treated cells; specificity score > 1.3 indicates statistically significant changes.

