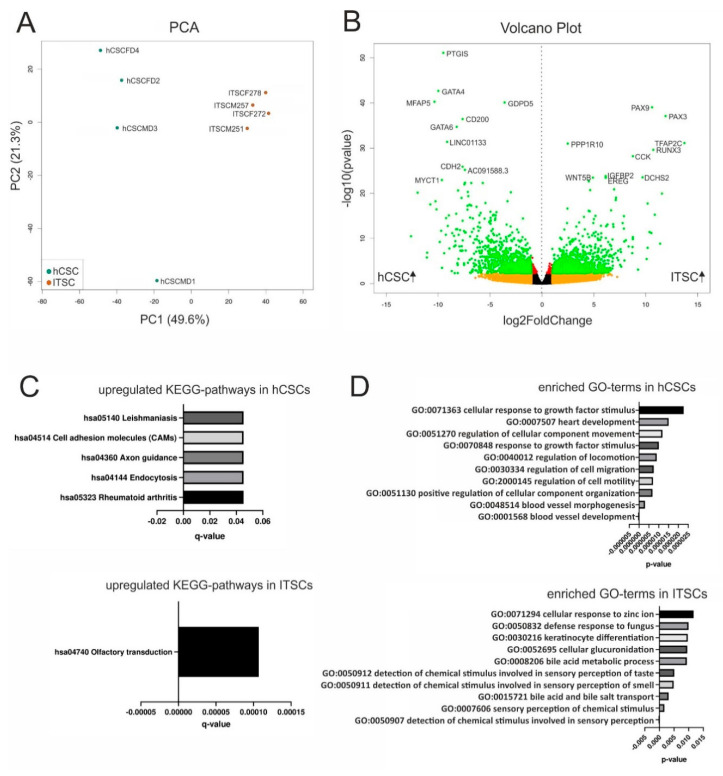
Figure 2.
Differential gene expression between hCSCs and inferior turbinate stem cells (ITSCs). (A) Principal component analysis shows that hCSCs and ITSCs build separate clusters. (B) The volcano plot shows 4367 significantly DEGs (green dots). (C) KEGG pathway analysis reveals six pathways to be significantly (p < 0.05) up- or downregulated between hCSCs and ITSCs. (D) Top ten of the most significantly enriched GO-terms referring to biological processes.

