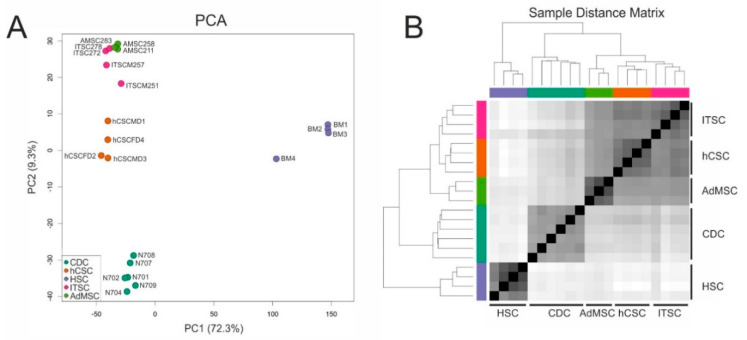
Figure 3.
Comparison of global gene expression profiles of adult stem cell populations from different sources. (A) Principal component analysis reveals that all cell populations cluster independently. (B) The sample distance matrix reveals great differences between hematopoietic stem cells (HSCs) and other adult stem cell populations.

