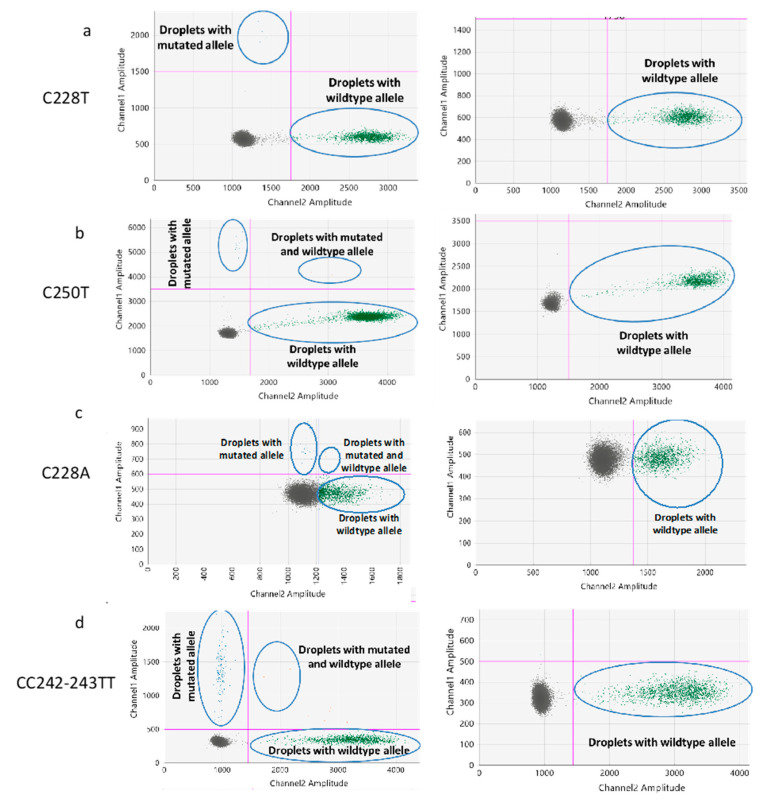
Figure 7.
Examples of 2D scatterplots obtained from TERT promoter mutation ddPCR assays in representative samples. Assays testing for C228T (a), C250T (b), C228A (c), and CC242-243TT (d) mutations are displayed in four examples of mutated samples (left panels) and in four examples of wild-type samples (right panels). In the left panel, fluorescent probes (FAM) detect respective mutations as exemplified by the count of droplets with mutated alleles, while in the right panel, wild- type samples do not show any positive droplets (FAM) above the threshold line but show droplets with HEX fluorescence associated with wild-type probes. The pink lines are the thresholds for channel 1 (mutated probe) and channel 2 (wild-type probe) for the ddPCR mutation assays.

