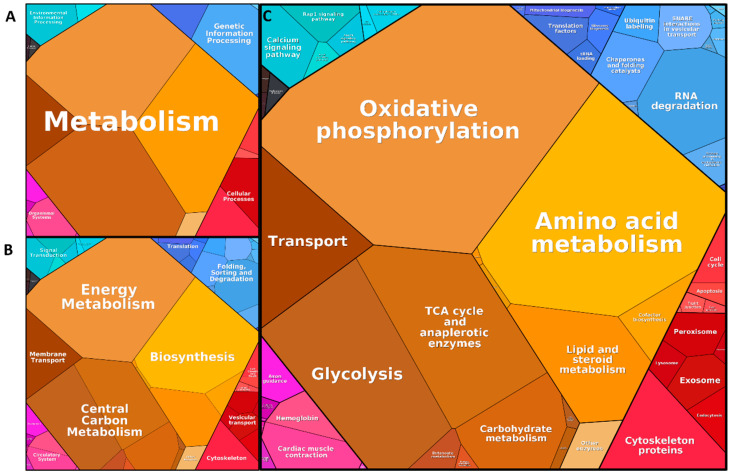
Figure 4.
Results of the annotation clustering by Bionic Visualizations Proteomaps. Different levels of information are shown, with a higher level meaning a more in-depth analysis: in (A), level 1 clustering; in (B), level 2 clustering, and in (C), level 3 clustering is shown. The larger the area the more proteins are assigned to the respective category. Terms are clustered in six main categories, as can be seen in (A), indicated by color: human diseases (black), environmental information processing (cyan), genetic information processing (blue), metabolism (yellow), cellular processes (red), and organismal systems (pink). Many proteins of the core proteome are connected in the yellow coded area metabolism (A). In level 2 (B), biosynthesis is prominent, while more in-depth analysis at level 3 (C) shows strong connection to terms like amino acid metabolism, lipid and steroid metabolism, and cofactor biosynthesis (for further details see Supplemental Figure S1A–D).

