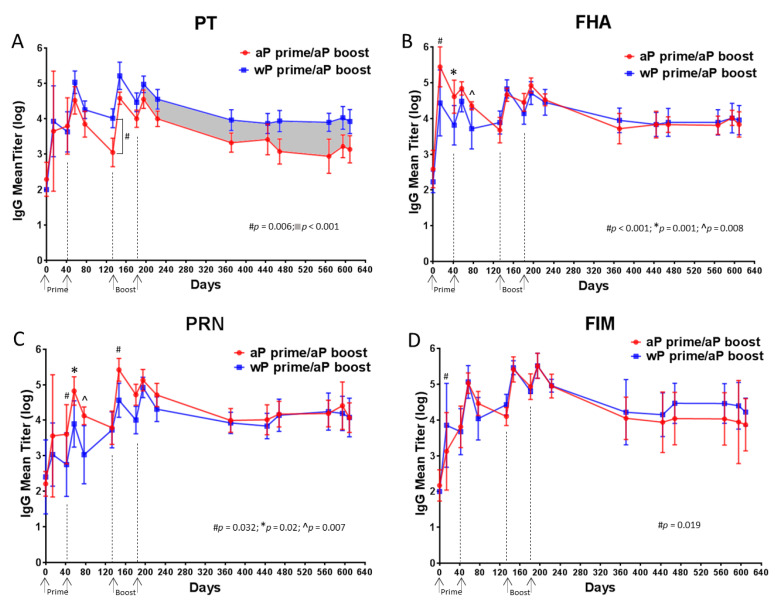
Figure 5.
Analysis of PT- (A), FHA- (B), PRN- (C), Fim 2/3 (D)-specific IgG antibodies revealed differences in durability and magnitude of response. The data shown in the graphs at each time point are the means of 6 individual values with 95% CI noted with the corresponding lines. A statistical analysis was performed using two different models: (i) ANOVA model with the specific primary vaccine immunization (aP or wP) as the fixed factor for each time point D14, D42, D57, D77, D133, D147, D181, D196. (ii) ANCOVA model with group as the fixed factor and time as the covariate from D196 to D609. The p values are listed on the specific graphs.

