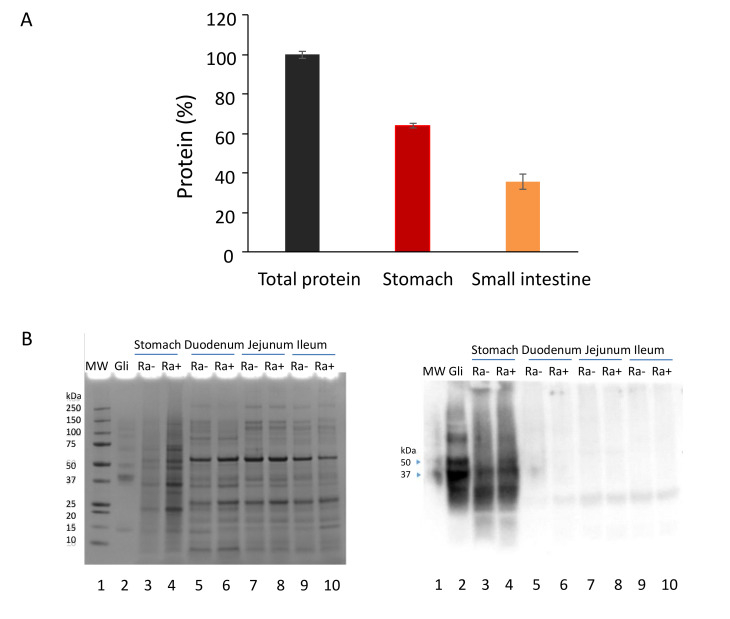
Figure 1.
Analysis of gastric and small intestinal contents. (A) Total protein content of the contents in the stomach (red) and small intestine (orange); n = 4 per organ; protein was determined by the BCA method multiplied by sample volume and divided by the total protein in both the stomach and intestine. (B) Analysis of gliadin in gastro-intestinal samples by SDS-PAGE (left panel) and anti-gliadin immunoblotting (right panel). Aliquots (63 µg protein) of the gastro-intestinal samples with R. aeria (Ra+) and without R. aeria (Ra−) bacteria were loaded on two 4–12% SDS-PAGE gels. After electrophoresis the gels were either stained with Coomassie brilliant blue (left) or processed by immunoblotting with an anti-gliadin antibody (right). Lanes 1: Protein standard, 5 µL; 2: Gliadin control (Gli, 25 µg); 3: stomach Ra (−);4: stomach Ra (+);5: duodenum Ra (−);6: duodenum Ra (+); 7: Jejunum Ra (−);8: jejunum Ra (+); 9: ileum Ra (−); 10: ileum Ra (+). Arrows: gliadin bands at 37 and 50 kDa.

