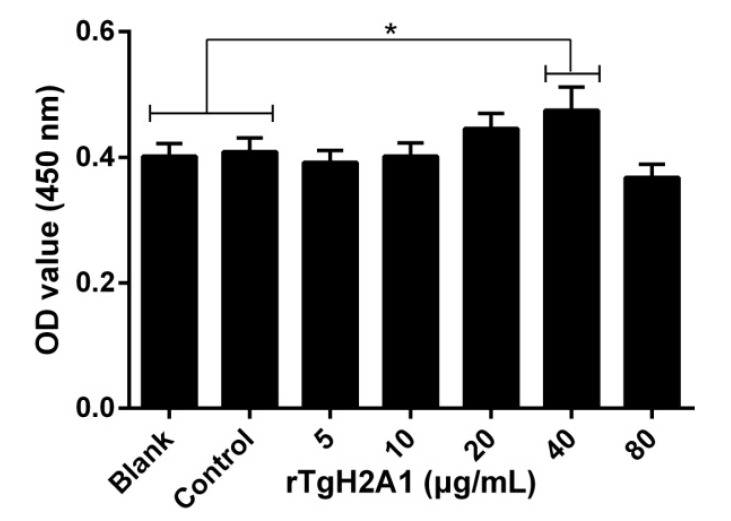
Figure 3.
Effects on proliferation of different concentrations (0, 5, 10, 20, 40, and 80 μg/mL) of rTgH2A1 on the murine macrophages. The proliferation assay was performed using the CCK-8 reagent kit. The cell proliferation index was calculated using the OD450 values. The Ana-1 cells in the blank groups were treated with PBS while those in the control group were treated with his-tagged protein. Results were evaluated using one-way ANOVA analysis followed by Dunnett’s test and expressed as mean ± standard deviation of three independent experiments. * p < 0.05 compared with the blank or control group.

