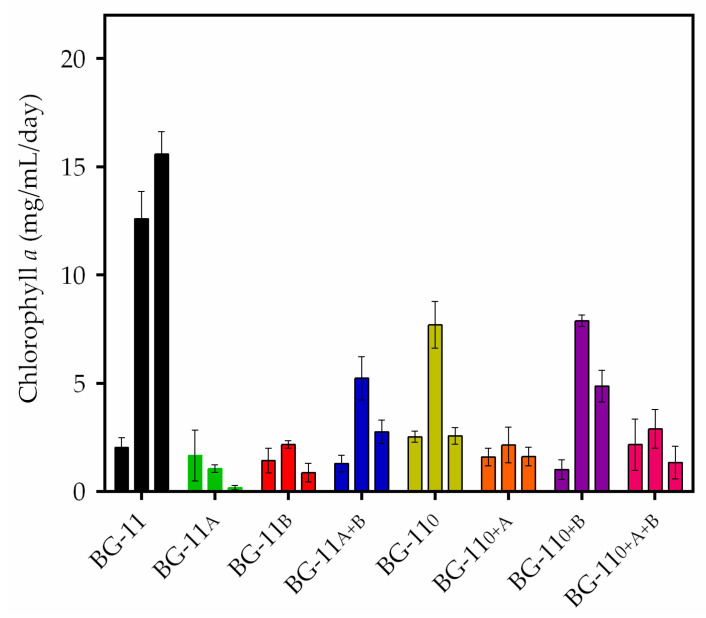
Figure 3.
Chlorophyll a concentration (mg/mL/day) of the Stigeoclonium sp. B23 in eight culture conditions. Three time points were plotted in each cultivation: the left bar corresponds to day 0 of the cultivation, the middle bar corresponds to day 15, and the right bar to day 30. Data are the mean ± SD of three replicates.

