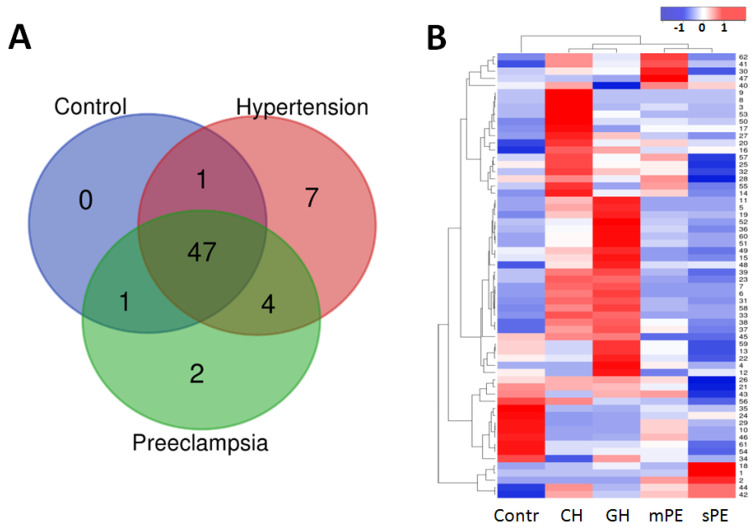
Figure 1.
The distribution of 62 substantially represented peptide loci in control, hypertension (CH and GH), and preeclampsia (mPE and sPE) patient groups. (A) Venn diagram demonstrating peptide group intersections. (B) Hierarchical clustering of the peptide loci’s median intensity values and pregnancy associated hypertensive disorders groups. The Kendal’s Tau distance measurement method and average linkage clustering were used. The higher values are shown in red, the lower—in blue.

