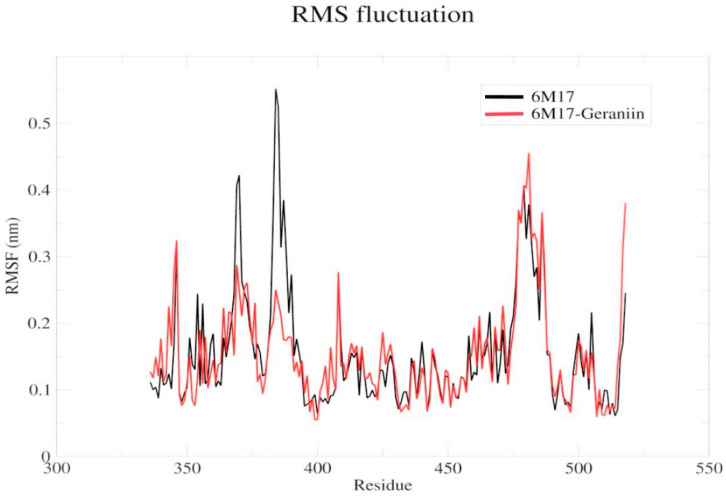
Figure 5.
Backbone RMSFs of the apo 6M17 and 6M17–geraniin complex structures. The black and red lines indicate the comparison of the apo 6M17 and 6M17–geraniin complex, respectively. The x and y axes indicate the residue numbers and the mobility in nm, respectively. (RMSF—Root Mean Square Fluctuation).

