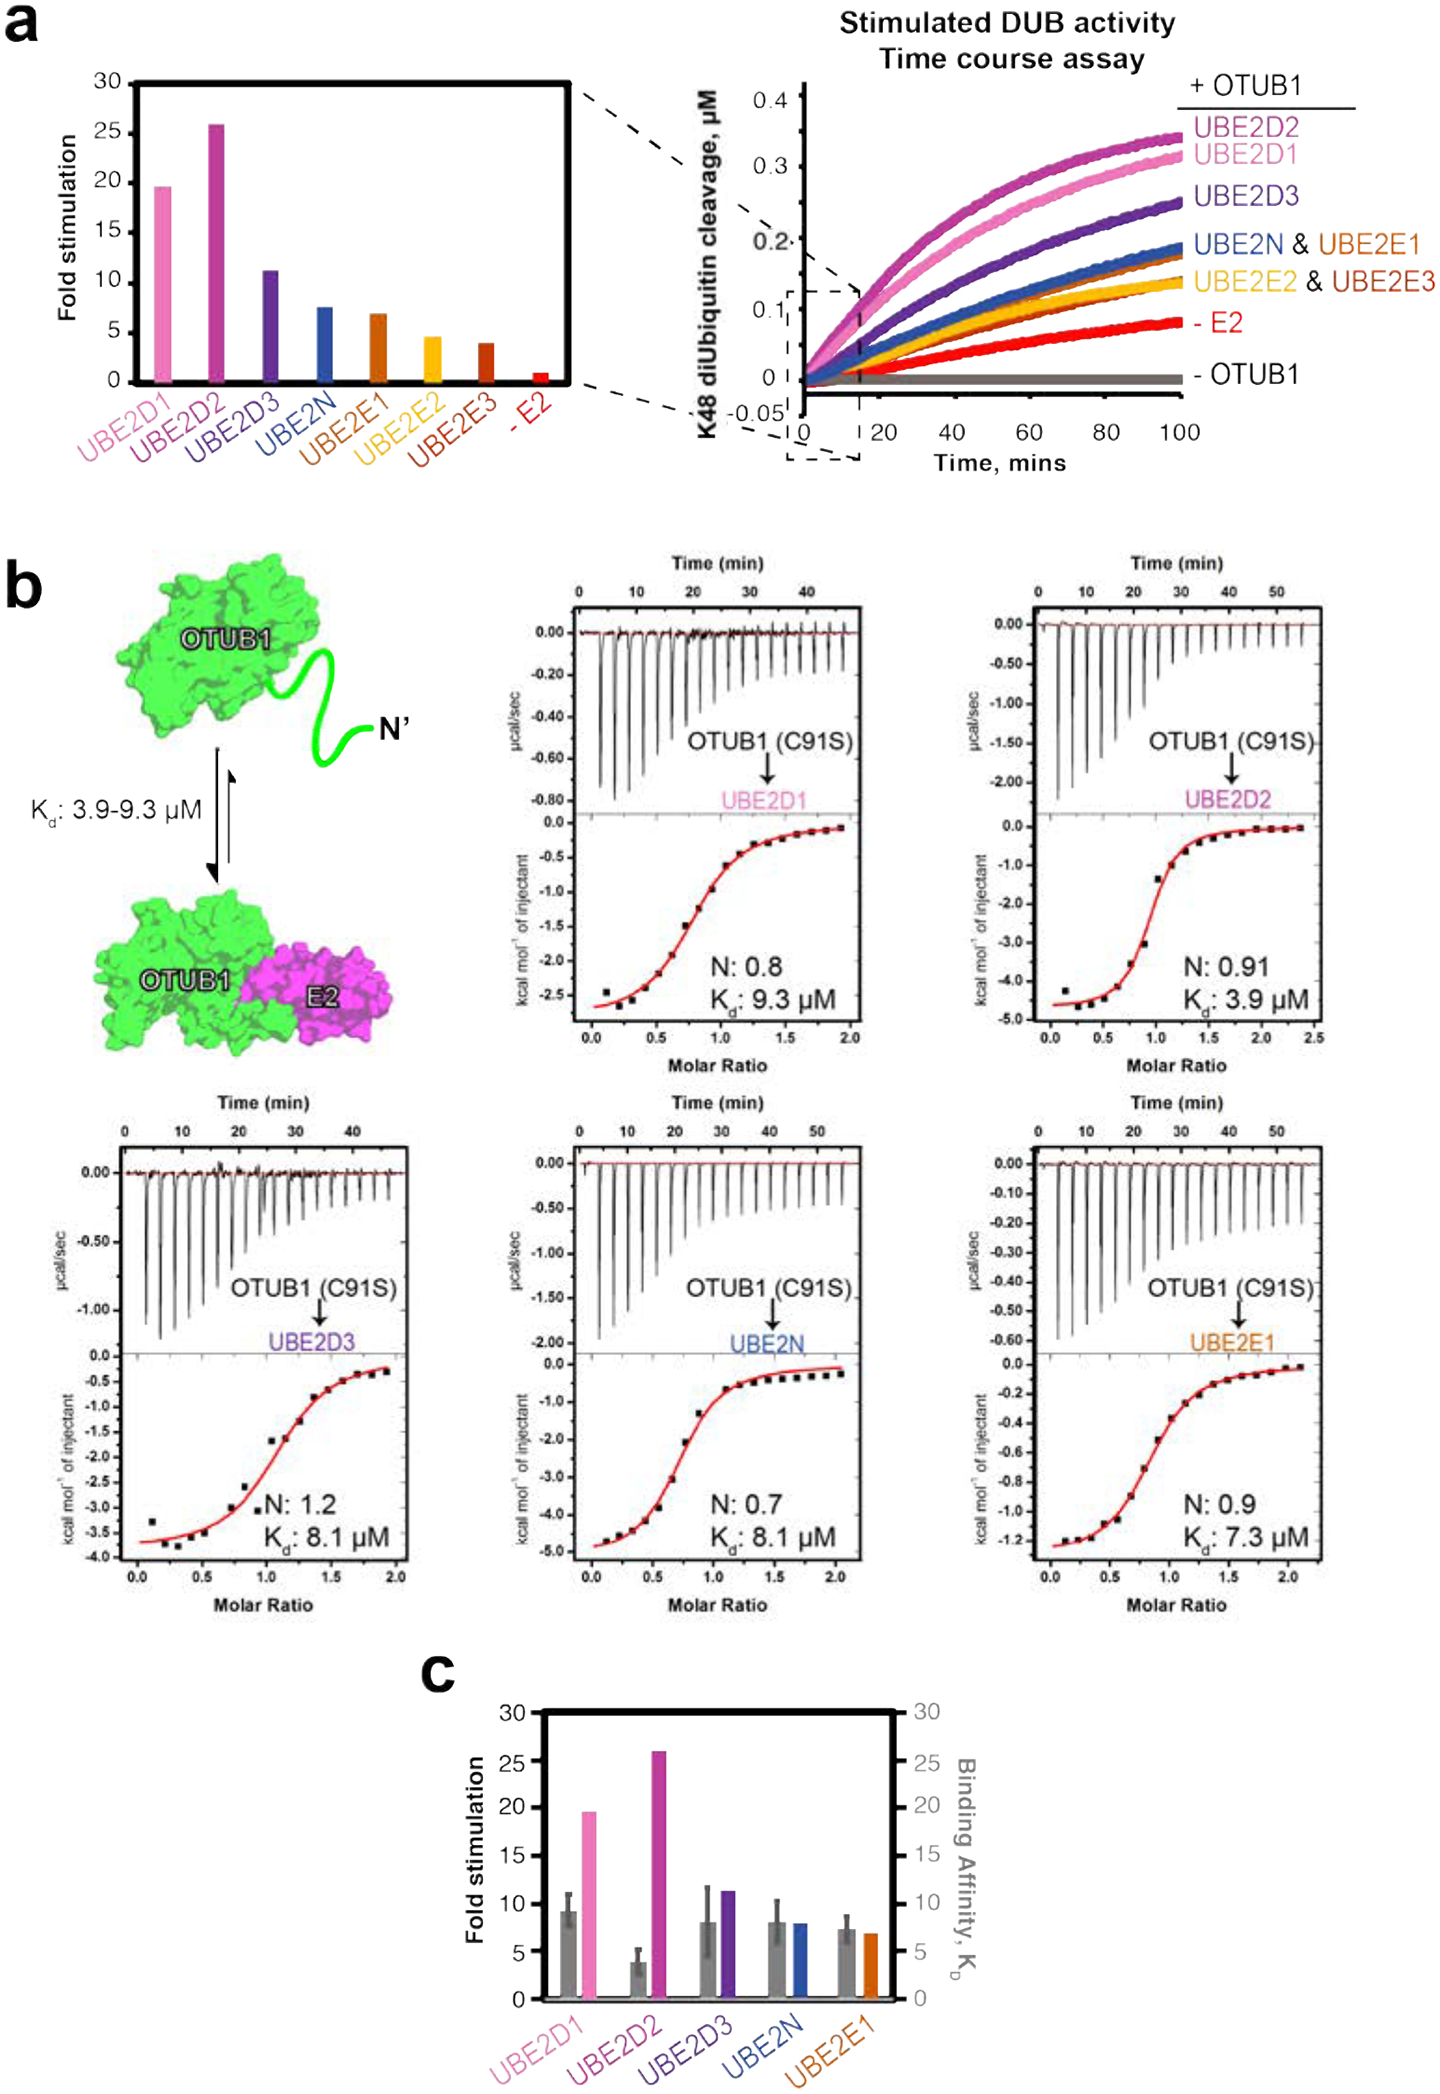
Figure 2. E2 stimulation of OTUB1 and E2-OTUB1 affinity.

(a) Fold stimulation of OTUB1 (50 nM) activity by the indicated E2 enzymes (10 μM) (left) determined from initial reaction rates in the FRET-based time course assay depicting cleavage of internally quenched fluorescent K48 diUbiquitin (400 nM) (right). (b) Binding schematic and ITC experiments for OTUB1 binding to the indicated E2 partner. OTUB1 (1.5 mM) was titrated into the corresponding E2 (150 μM), contained within the cell. (c) Side-by-side comparison of Kd values measured in (b, colored grey and right axis) with the fold stimulation determined in (a, multicolored and left axis) for the indicated E2s.
