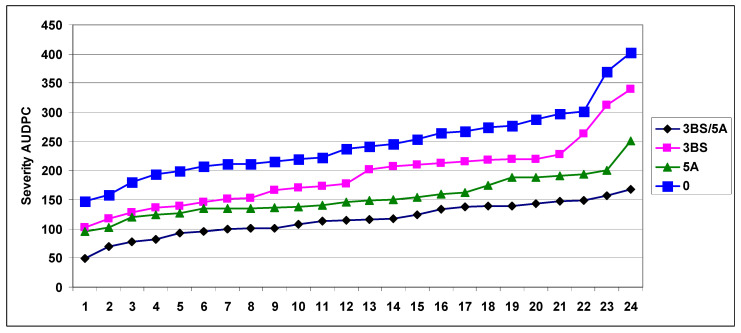
Figure 6.
Area under disease progress curve (AUDPC) values for disease severity in the CM82036/Remus population across years, isolates, and location, 2002–2003. Limit of significant difference (LSD) 5% for genotypes 32.54, for quantitative trait locus (QTL) groups 6.62 [53].

