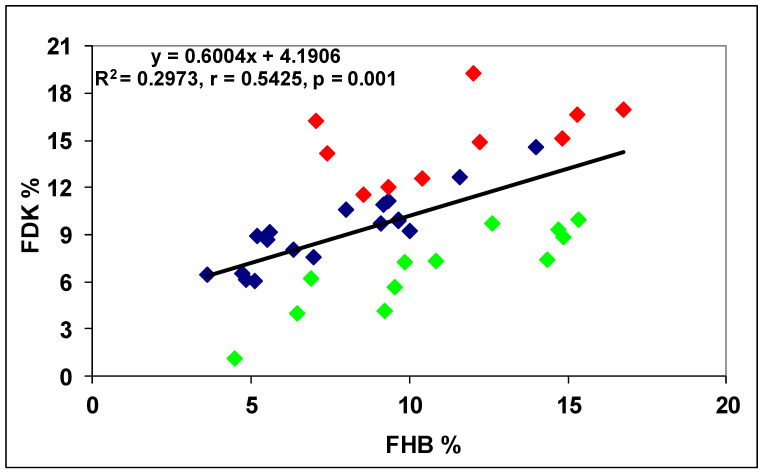
Figure 11.
DI and FDK regression in FHB resistance tests in winter wheat genotypes against two F. graminearum and two F. culmorum strains, 2009–2012. Red data: FDK overproduction, data from the regression line are farer than the LSD 5% 1.66 to the larger DON concentrations; green data: resistance to kernel infection, data from the regression line are farer than the LSD 5% 1.66 to the lower DON concentrations. LSD 5%: for FDK is 1.66 [26].

