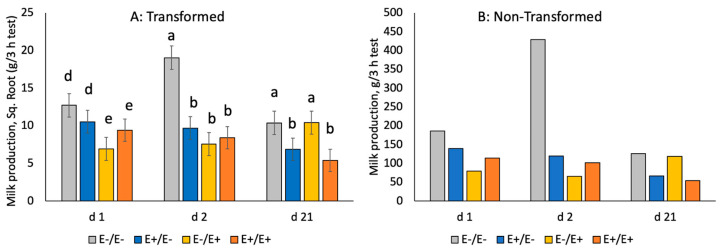
Figure 6.
Milk production (g/3 h test) in ewes fed E− or E+ seed in MID or LATE gestation. Superscripts denote significance (a,b p < 0.05; d,e p < 0.10) by day of lactation. Milk production data were not normally distributed and were square-root-transformed for statistical analyses (A). Actual means, non-transformed, are also presented for easier understanding and interpretation (B).

