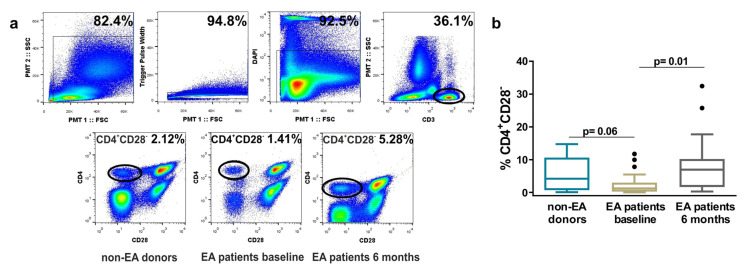
Figure 1.
Frequency of resting CD4+CD28− cells in non-early arthritis (non-EA) donors and EA patients determined by flow cytometry. (a) Up, representative gates to identify CD3+ cells are shown. Down, a representative dot plot analysis in each study group is shown. (b) The percentage of CD4+CD28− cells from 13 non-EA donors and 25 EA patients at baseline and after 6 months of disease progression is shown. Data are presented as the interquartile range (p75 upper edge of the box, p25 lower edge, and p50 midline), p90 (line above the box), and p10 (line below the box). Dots represent outliers. Statistical significance was established using Mann–Whitney (non-EA/EA baseline) and Wilcoxon t test (EA baseline/EA after 6 months).

