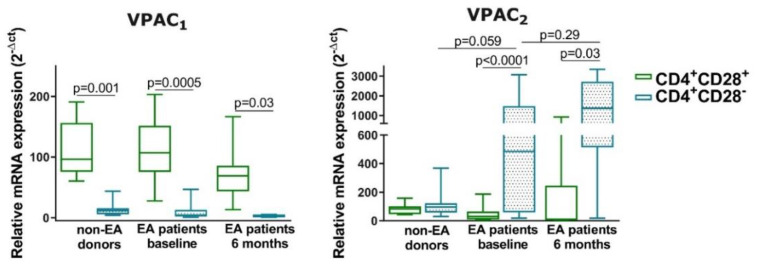
Figure 5.
mRNA expression of VPAC1 and VPAC2 in resting CD4+CD28− cells from non-EA donors and EA patients. RNA expression of VPAC1 and VPAC2 receptors was determined by semiquantitative real-time PCR analysis in non-EA donors, EA patients at baseline, and after 6 months of disease progression. Results are expressed as relative mRNA levels (normalized to GAPDH mRNA levels, 2−ΔCt). Data are presented as the interquartile range (p75 upper edge of the box, p25 lower edge, and p50 midline), p90 (line above the box), and p10 (line below the box) from 11 different non-EA donors and 12 EA patients. Statistical significance was established using Wilcoxon t test for the comparison between CD4+CD28+ and CD4+CD28− and Mann–Whitney test for the comparison between cells from different groups.

