Figure 3.
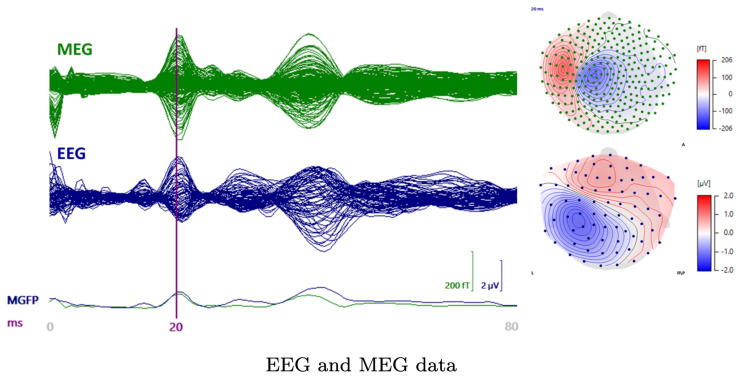
A butterfly plot of the somatosensory evoked field (SEF) (upper left) and potential (SEP) (lower left) from 0 to 80 ms post-stimulus with the 20 ms time point being indicated by the vertical line. The P20/N20 peak topographies for SEF (upper, right) and SEP (lower right) are also visualized.

