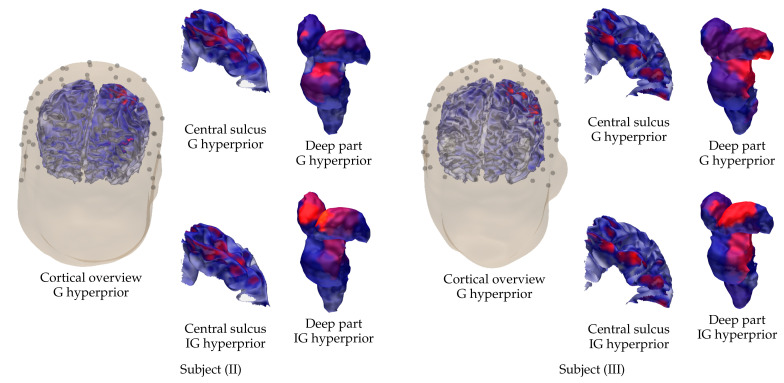
Figure 10.
Visualization of the cortical and sub-cortical activity reconstructed for subjects (II) on the left and (III) on the right using the EEG data corresponding to the P20/N20 component. In addition to the cortical overview, showing the reconstruction that was obtained with G hyperprior, excerpts of the cortical activity around the central sulcus and the sub-cortical (deep) activity are shown for G and IG hyperprior.

