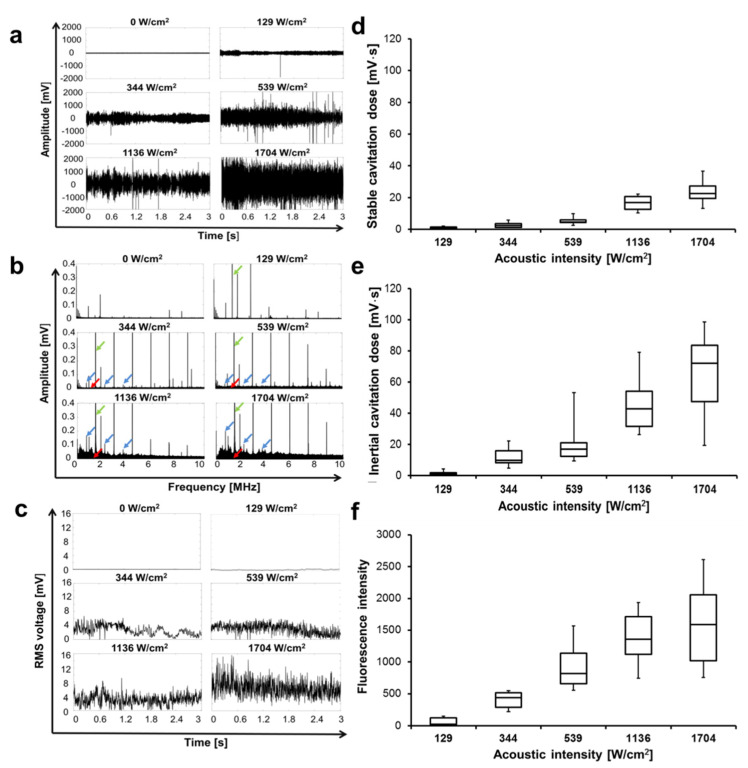
Figure 3.
Representative acoustic emission signals at 1.467 MHz and influence of acoustic intensity on the type and dose of cavitation. (a) The time-domain plots of the acoustic signals for one recording period of 2.9 s. (b) Corresponding frequency-domain plots; green arrow: fundamental frequency (f0) 1.467 MHz; blue arrow: sub- and ultra-harmonics (f = m × f0 /2, m = 1, 3, 5…) represent stable cavitation; red arrow: broadband noise represent inertial cavitation. (c) Root-mean-square (RMS) voltage of the broadband noise as a function of exposure time. (d) Stable and (e) inertial cavitation dose with a sonication duration of 40 s measured with a fiber-optic hydrophone, n = 9. (f) Fluorescence intensity measured by the terephthalic acid (TA) method indicates an inertial cavitation dose with a sonication duration of 40 s, n = 9.

