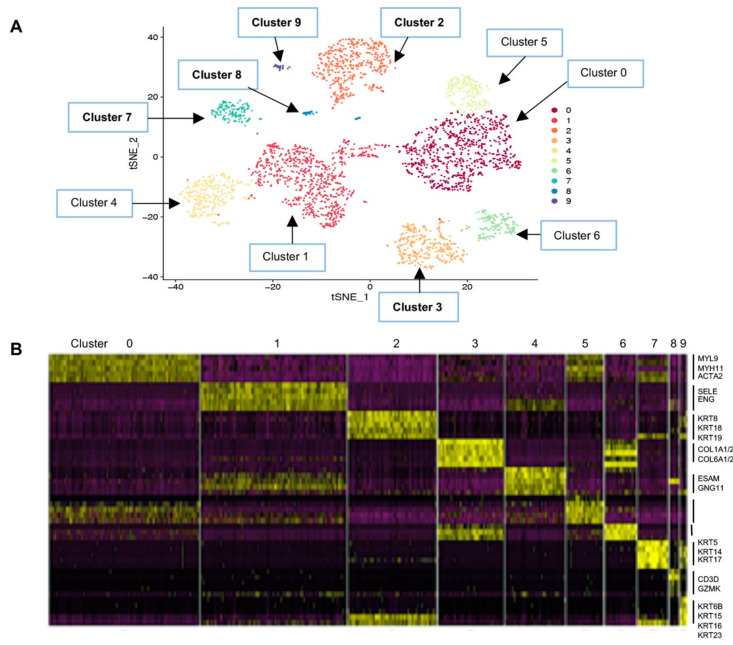
Figure 2.
Human breast single-cell RNA sequencing (scRNAseq) clustering analysis. (A) t-Distributed stochastic neighbor embedding (t-SNE) map of scRNAseq data visualizing 10 cell clusters marked Clusters 0–10, in the order of the largest group of cells (Cluster 0) to the smallest (Cluster 9) listed in Table 1; (B) heat map of differentially expressed genes in each cluster. Some of the genes representing Clusters 1, 2, 3, 4, 5, 7, 8, and 9 are listed on the right side of the panel and in Table 1. Yellow to dark purple, high to low expression (the 100 genes differentially expressed in each cluster are listed in Table S1).

