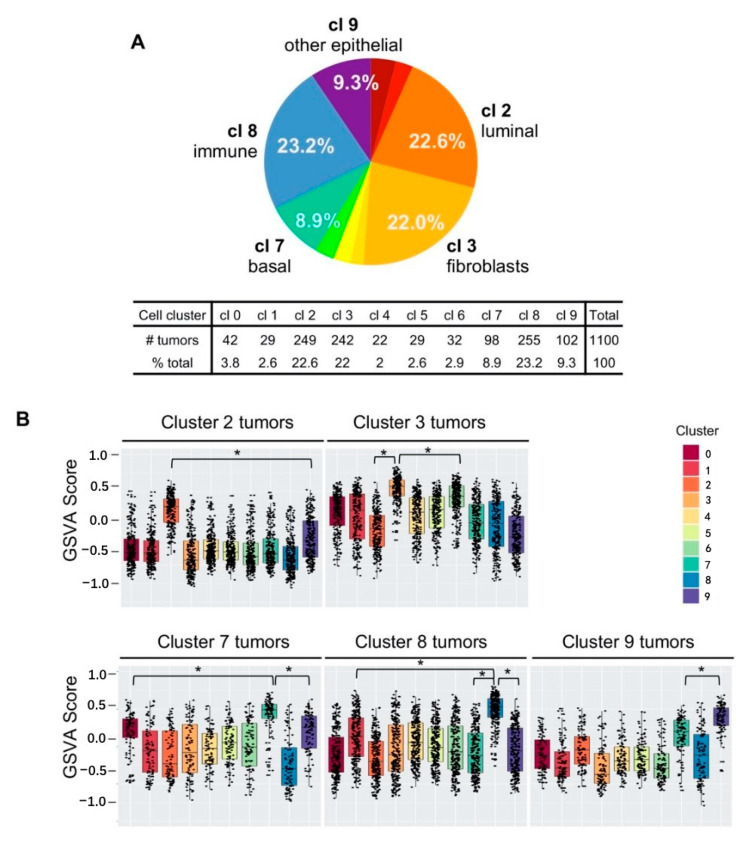
Figure 5.
The gene signatures from five single cell clusters collectively classified 86% of breast tumors in The Cancer Genome Atlas (TCGA) dataset. (A) Percentages of breast tumors that matched to single cell clusters according to the gene set variation analysis (GSVA) scores. cl 2, Cluster 2; cl 3, Cluster 3; cl 7, Cluster 7; cl 8, Cluster 8; cl 9, Cluster 9; (B) cell cluster assignment showing the distribution of the assigned number. Cluster 2 tumors had the highest GSVA scores for the Cluster 2 gene signature compared to the other gene signatures (top left panel). Clusters 2, 3, 7, 8, and 9 are shown. Black dots represent a single tumor. All pairwise comparisons were significant; * p < 0.0001 was used to highlight the significance.

