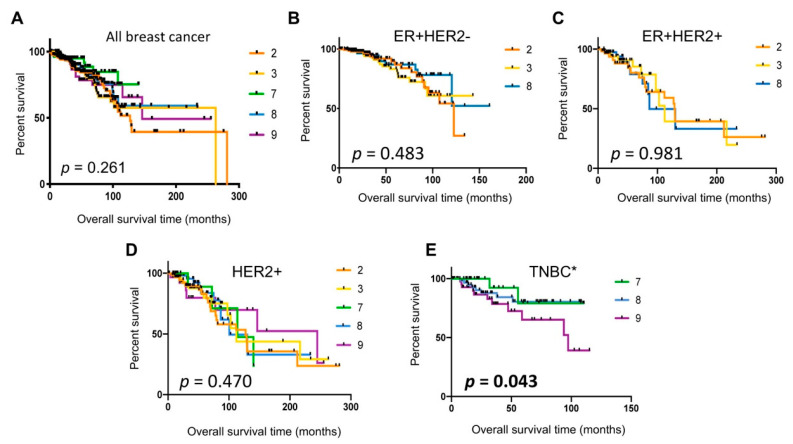
Figure 7.
Kaplan–Meier survival analyses of TCGA breast cancer patient data using the single-cell cluster classification. (A) All breast cancer; (B) ER+HER2−; (C) ER+HER2+; (D) ER−HER2+; (E) TNBC. The p-values were determined by the log-rank test for trend. * Comparison between Cluster 7 and Cluster 9 tumors in TNBC, hazard ratio (HR) 3.493, 95% confidence interval (CI) 1.14–10.66.

