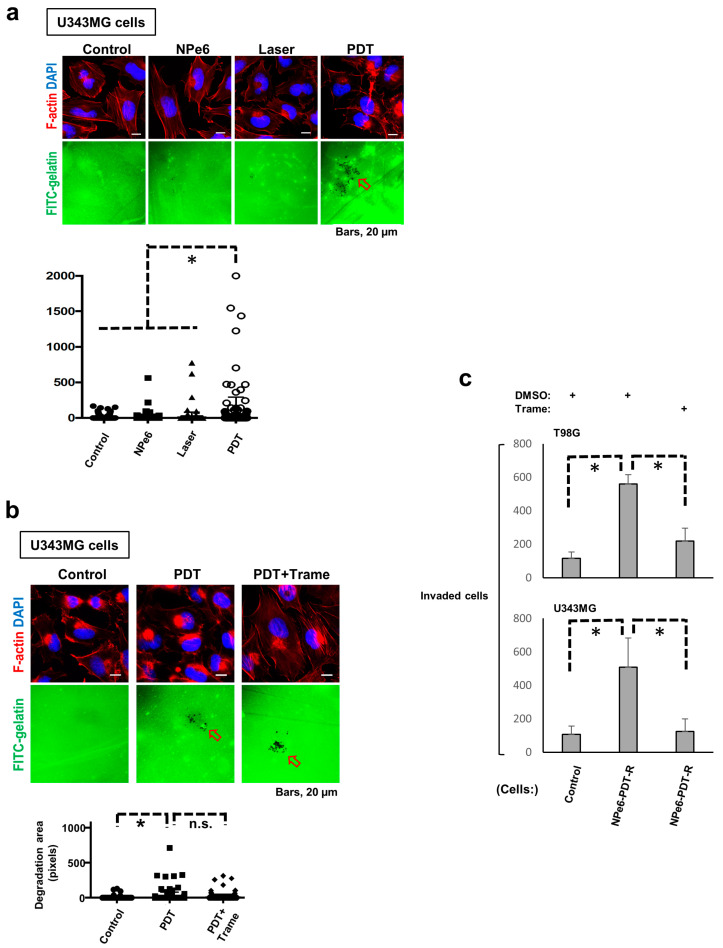
Figure 5.
Invasion of NPe6-PDT-R cells is augmented in an ERK1/2 activation-dependent manner, but extracellular matrix degradation in NPe6-PDT-R cells is upregulated independent of ERK1/2 activation. (a) U343MG cells were subjected to vehicle treatment, NPe6 treatment (15 μg·mL−1), laser treatment, or NPe6-PDT (NPe6, 15 μg·mL−1) as shown in the figure. After 3 days, these cells were subjected to the invadopodia assay as described in the Materials and Methods. Representative fluorescence images of confocal microscopy (upper) [red fluorescence, phalloidin (actin); blue fluorescence, DAPI (nucleus); green fluorescence, FITC-gelatin] and invadopodia formation (lower, * p < 0.01) were examined. Arrowhead denotes degradation sites on the gelatin matrix. (b) U343MG cells were subjected to vehicle treatment (control) and/or NPe6-PDT (NPe6, 15 μg·mL−1). After 3 days, the cells were subjected to invadopodia assay with or without trametinib pretreatment (10 μM) for 12 h, and the results are shown in Figure 5A. Arrowheads denote degradation sites on the gelatin matrix. * p < 0.01. (c) T98G and U343MG cells were subjected to vehicle treatment (control) or NPe6-PDT (NPe6-PDT-R, NPe6, 15 μg·mL−1). After 5 days, the cells were subjected to transwell invasion assay with vehicle, trametinib (DMSO), or trametinib (10 μM) pretreatment for 12 h, as described in the Materials and Methods. * p < 0.01.

