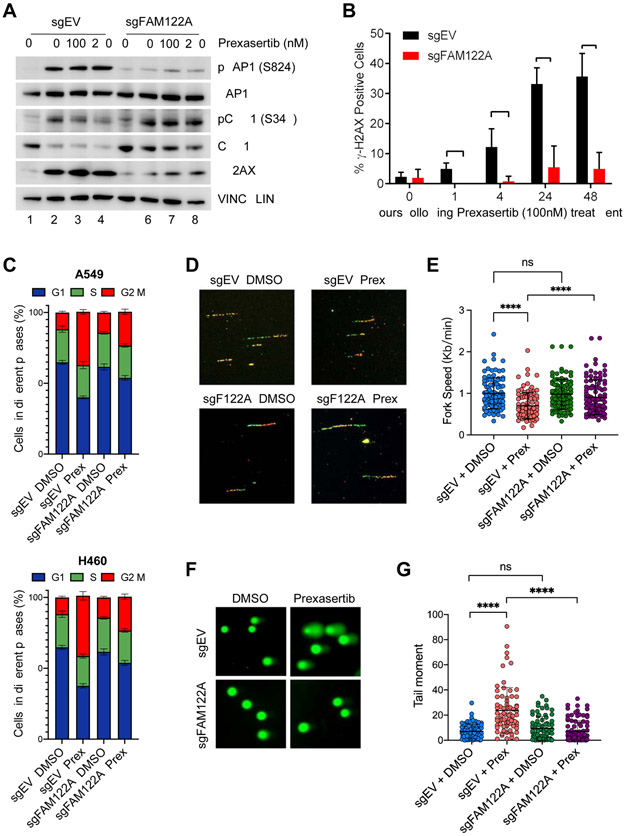
Figure 2. FAM122A loss rescues lung cancer cells from replication stress, DNA damage and G2/M arrest caused by CHK1i.
(A) Western blots of the lysates from control and FAM122A-KO A549 cells after treatment with prexasertib for 24 hrs.
(B) Quantification of γH2AX foci in control and FAM122A-KO A549 cells after treatment with prexasertib for up to 48 hrs. Error bars indicate standard errors and P-values were calculated using the Student t-test (n=3, *p < 0.001).
(C) Cell cycle distribution of Pi-stained control and FAM122A-KO A549 (upper panels) and H460 (lower panels) cells treated with 250nM prexasertib for 24 hrs. Data are shown as mean ± SD from three independent experiments.
(D) Representative images of the DNA fibers in control and FAM122A-KO A549 cells after treatment with with DMSO or prexasertib (100nM) for 24 hrs. Cells were sequentially labeled with IdU and CldU after exposure to prexasertib for 24 hrs and the DNA fiber assay was performed to determine the replication fork speed.
(E) Quantitation of the replication fork speed in control and FAM122A-KO A549 cells after treatment with DMSO or prexasertib (100nM) for 24hrs. DNA fibers in panel (D) were analyzed from >100 ongoing replication forks in each condition. Error bars indicate standard errors and P-values were calculated using the Student t-test (****p < 0.0001).
(F) Representative images of alkaline comets in control and FAM122A-KO A549 cells exposed to prexasertib (250nM) for 24 hrs.
(G) Quantitation of the comet tail moment in panel (F) from more than 100 cells in each condition. Error bars indicate standard errors and P-values were calculated using the Student t-test (****p < 0.0001).

