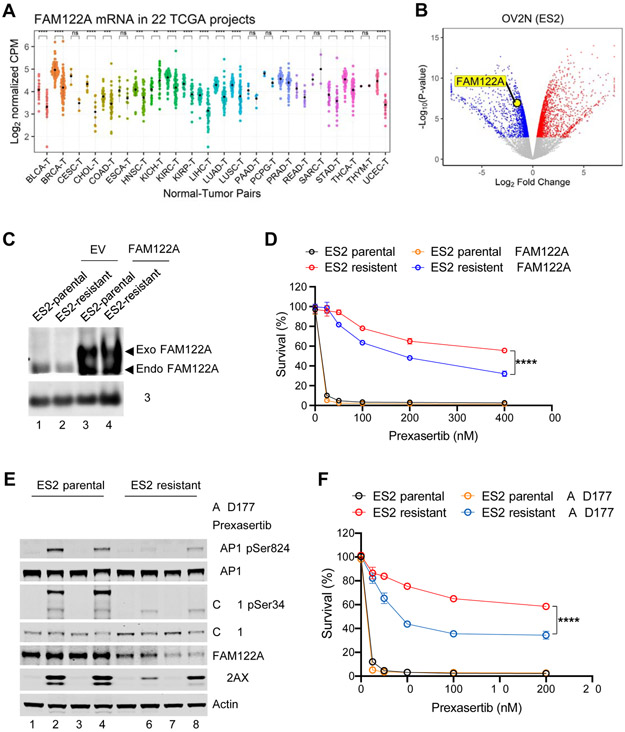
Figure 6. FAM122A is a predictive biomarker for CHK1 inhibitor response in multiple cancer types.
(A) FAM122A RNAseq expression in tumors (right) with matched normal tissues (left). The data are analyzed using 22 TCGA projects. Note that FAM122A expression is lower in many cancers compared to the matched normal tissues.
(B) Volcano plot showing genes differentially downregulated or upregulated in prexasertib resistant ES2 ovarian cells (OV2N ES2) compared to the parental cells. Note that FAM122A expression is significantly decreased in ES2 cells with acquired resistance to prexasertib.
(C) Western blots of the lysates from stably expressing FAM122A-Flag or FLAG-control (EV) parental and prexasertib-resistant ES2 cells. Note that anti-H3 was used as a protein loading control.
(D) Survival plots of stably expressing FAM122A-Flag or FLAG-control parental and prexasertib-resistant ES2 cells after treatment with graded concentrations of Prexasertib for 3 days. Data are shown as mean ± SD from three independent experiments. ES2-resistant versus ES2-resistant+FAM122A, ****P<0.0001, statistical analysis was performed using two-way ANOVA.
(E) Western blots of the lysates from parental and prexasertib-resistant ES2 cells after treatment with prexasertib (50nM) and AZD1775 (50nM) for 24 hrs.
(F) Survival plots of parental and prexasertib-resistant ES2 cells after treatment AZD1775 (50nM) and graded concentrations of prexasertib for 3 days. Data are shown as mean ± SD from three independent experiments. ES2-resistant versus ES2-resistant+AZD1775, ****P<0.0001, statistical analysis was performed using two-way ANOVA.

