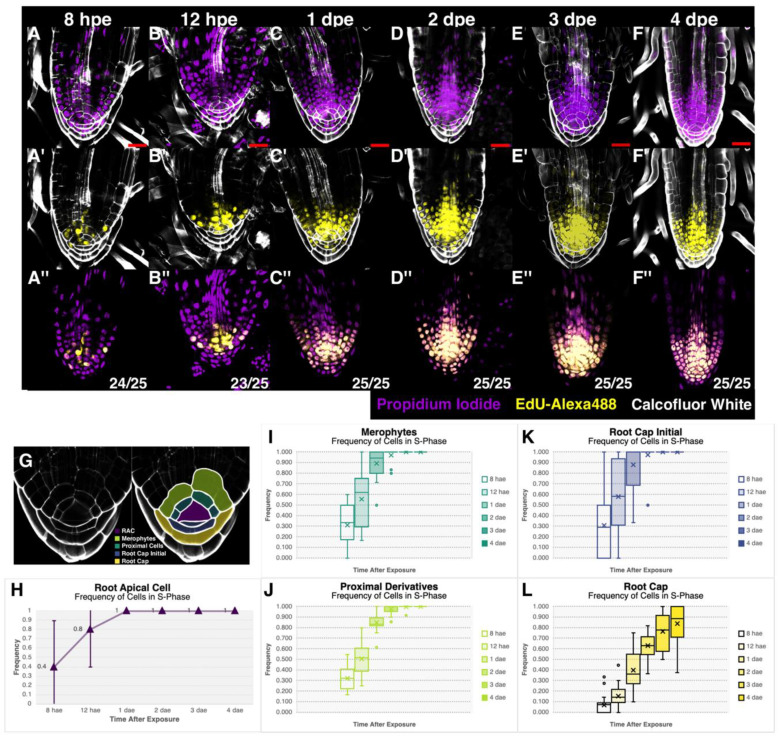
Figure 6.
Cellular dynamics of the first shoot-borne root. (A–F) EdU incorporation experiment to detect cells in their S-phase of cell cycle at 8 hae (A,A′,A″), 12 hae (B,B′,B″), 1 dae (C,C′,C″), 2 dae (D,D′,D″), 3 dae (E,E′,E″), and 4 dae (F,F′,F″). (A to F) DNA counterstaining and cell wall staining (Propidium Iodide—Purple; Calcofluor White—White); (A′–F′) EdU-labeled DNA and cell wall staining (EdU-Alexa488—Yellow; Calcofluor White—White); (A″–F″) EdU-labeled DNA and DNA counterstaining merge (EdU-Alexa488—Yellow; Propidium Iodide—Purple). Scale bar: 20 μm. hae—hours after exposure; dae—days after exposure. Numbers in the right bottom corner of Figure 6A″–F″: Amount of plants displaying the triple staining/Total amount of plants used in the experiment (G) Established zonation inside the stem cell niche. The following plots represent the average frequency of cells entering the S-phase of the cell cycle in a specific zone of Ceratopteris root apical meristem at different times of EdU incorporation: (H) Scattered plot of the frequency of S-phase cells in the RAC. (I–L) Box plots showing the frequency of entering the S-phase of cell cycle in the different zones of the RAM: merophytes (I); proximal cells (J); root cap initials (K); root cap cells (L). The frequency of cells entering to S-phase was statistically determined with a student’s t test for each cell type. Note: brightness of the Alexa-488 channel in Figure 6F″ was decreased when compared to previous times in order to have a better observation of both merged channels.

