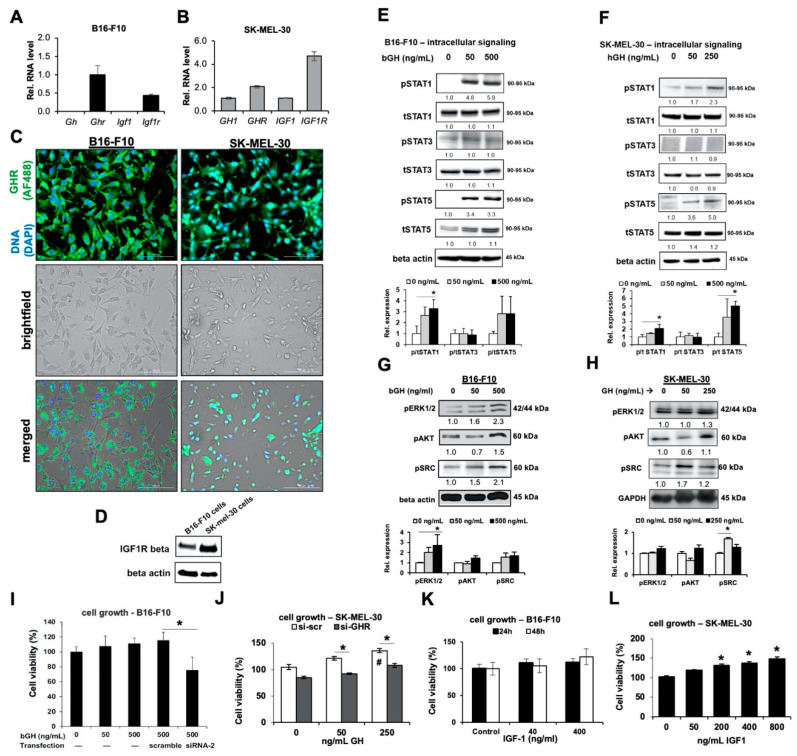
Figure 1.
Melanoma cells are responsive to GH treatment in vitro. (A) Relative RNA expression was quantified for Gh, Ghr, Igf1 and Igf1r genes in B16-F10 mouse melanoma cells (n = 3). (B) Relative RNA expression was quantified for GH, GHR, IGF1 and IGF1R genes in SK-MEL-30 human melanoma cells, normalized against GAPDH (n = 3). (C) B16-F10 and SK-MEL-30 cells were stained with GHR antibody. Top panels present cellular DNA stained with DAPI (blue) and fluorescent signals from AF488-tagged anti-GHR antibody (green). Middle panels represent brightfield views while bottom panels represent merged views (20× magnification; scale bar represents 100 μm). (D) Expression of IGF1R-beta was detected in B16-F10 and SK-MEL-30 cells via western blotting. (E) Representative images of western blot analyses of phosphorylation (p) and total (t) levels of STATs 1, 3 and 5 in bovine GH (bGH) treated B16-F10 melanoma cell lysates. Cells were treated for 30 min and lysed. Densitometry analysis was performed and normalized against β-actin. The fold changes relative to control are labeled under each band. The ratio of p/t protein levels are quantified against controls and shown in bar graphs (n = 3). (F) Similar results for SK-MEL-30 cells treated with human (h) GH for 30 min were obtained. (G,H) Changes in GH signaling proteins, pERK1/2, pAKT and pSRC, in B16-F10 cells and SK-MEL-30 cells treated with bGH or hGH for 48 h. Protein levels were normalized against β-actin or GAPDH. (I) Changes in cell proliferation of B16-F10 cells transfected with scramble or GHR-targeted siRNA (siRNA-2), after 48-h treatment with bGH. (J) Similar results were observed in SK-MEL-30 cells transfected with scramble (si-scr) or GHR-targeted siRNA (si-GHR), after 48-h treatment with hGH (* as compared with si-scr group, # as compared with no treatment group). (K) Changes in cell proliferation of B16-F10 cells treated with increasing doses of IGF-1 for 24 and 48 h. (L) Changes in cell proliferation of SK-MEL-30 after 48-h treatment with recombinant human IGF-1 (n = 5). Data are presented as mean ± standard deviation (*, p < 0.05, Mann-Whitney U test).

