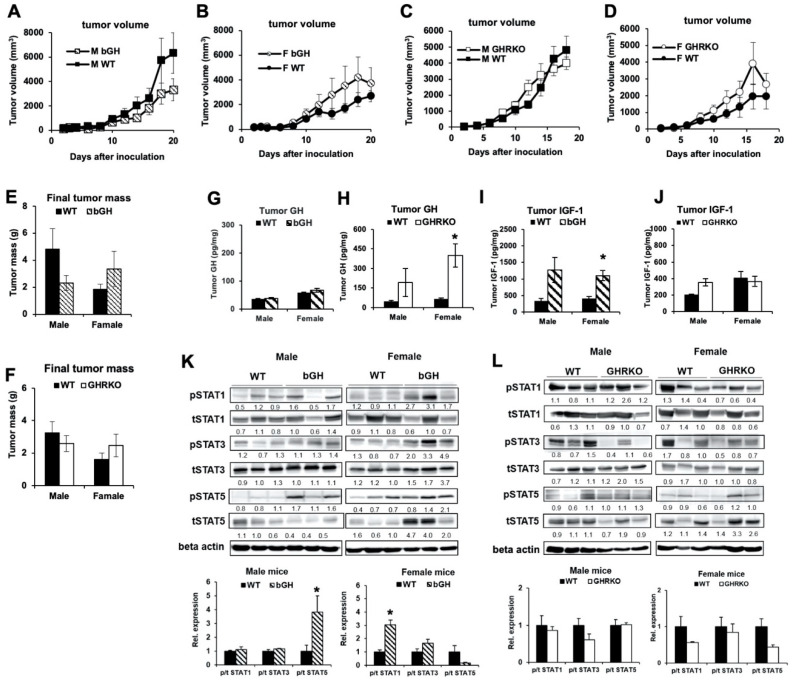
Figure 2.
Subcutaneous B16-F10 mouse melanoma growth in bGH and GHRKO syngeneic mice. (A) Subcutaneous B16-F10 tumor growth in male bGH (n = 5) vs. WT mice (n = 6). (B) Subcutaneous B16-F10 tumor growth in female bGH (n = 7) and WT mice (n = 6). (C) Subcutaneous B16-F10 tumor growth in male GHRKO (n = 6) vs. WT (n = 8) mice. (D) Subcutaneous B16-F10 tumor growth in female GHRKO (n = 4) and WT mice (n = 5). Tumor sizes were analyzed by repeated measures (SPSS). (E) Weight of subcutaneous B16-F10 tumors from bGH vs. WT mice at dissection. (F) Weight of subcutaneous B16-F10 tumors from GHRKO vs. WT mice at dissection. (G) GH levels were measured in protein lysates isolated from tumors of bGH and WT mice using ELISA and normalized to total protein concentrations (n = 4). (H) Similar GH measurements were performed in protein lysates isolated from tumors of GHRKO and WT mice (males n = 3, females n = 4). (I) IGF-1 levels were measured in protein lysates isolated from tumors of bGH and WT mice using ELISA and normalized to total protein concentrations (n = 4). (J) Similar IGF-1 measurements were performed in protein lysates isolated from tumors of GHRKO and WT mice (males n = 3, females n = 4). (K) Representative images of western blot analysis of phosphorylation (p) and total (t) levels of STAT1, STAT3 and STAT5 in protein lysates isolated from tumors of bGH and WT mice. Densitometry analysis was performed and normalized against β-Actin. The relative expression levels (fold change relative to WT) are labeled under each band. The ratio of phosphorylated vs. total protein levels in tumors from bGH and WT mice are presented in bar graphs (n = 4). (L) Representative images of western blot analysis of phosphorylation and total levels of STAT1, STAT3, and STAT5 in protein lysates isolated from tumors of GHRKO and WT mice. (males n = 3, females n = 4). Data are presented as mean ± standard errors (*, p < 0.05, unpaired student’s t-test).

