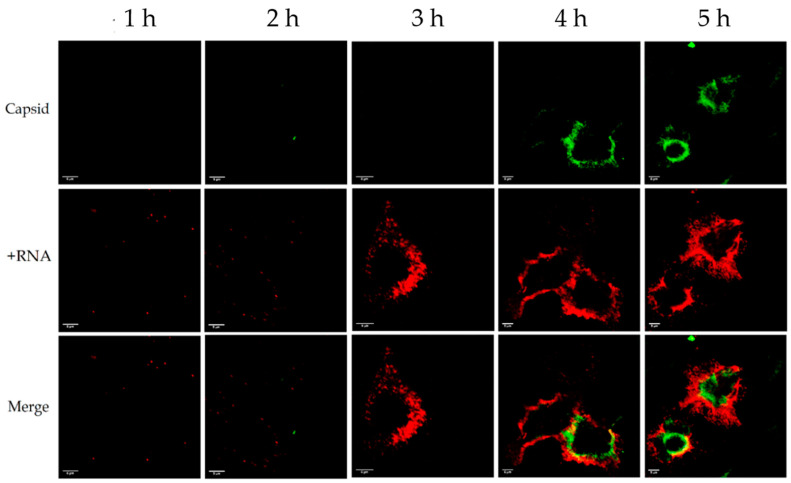
Figure 1.
Distribution of viral +RNA and capsid protein in coxsackievirus A9 (CVA9)-infected cells 1–5 h post-infection (p.i.). The capsid protein is shown in green and the +RNA is shown in red. The rows from left to right are 1, 2, 3, 4, and 5 h p.i. Capsid protein became visible after 4 h p.i. and +RNA was visible at all timepoints, but surged in visibility at 3 h p.i. Around 30% of the capsid colocalized with the +RNA. Scale bar in every image is 5 µm.

