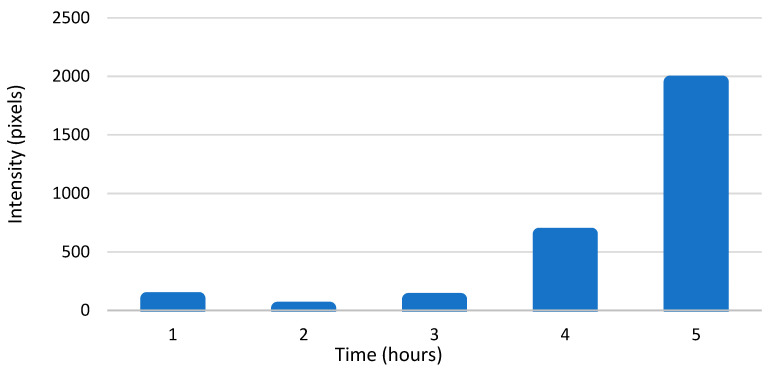
Figure 5.
The amount of viral +RNA in CVA9-infected cells at timepoints 0–5 h p.i., as calculated from branched DNA (bDNA) fluorescent in situ hybridization (FISH) image intensity values. The bars represent pixels that have intensity values above the background threshold, calculated from ≈100 cells.

