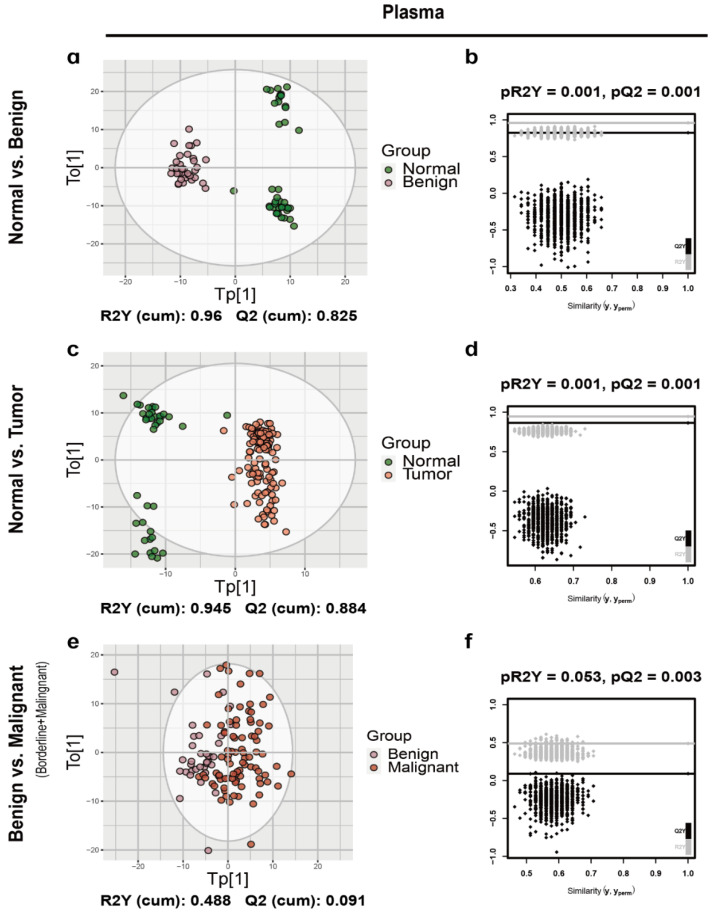
Figure 2.
The OPLS-DA score plot and the permutation test results of plasma samples. The OPLS-DA score plot between (a) normal and benign, (c) normal and ovarian tumor and (e) benign and malignant (borderline + malignant) ovarian tumors in urine samples and the corresponding permutation test results (b,d,f).

