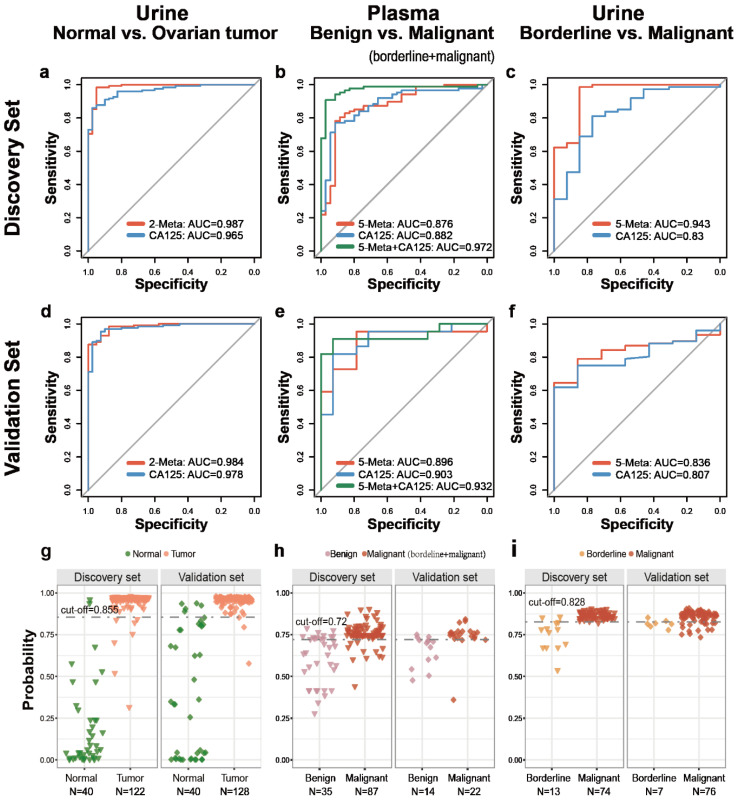
Figure 4.
Diagnostic performance and prediction plot of biomarkers in urine or plasma sample. The diagnostic performance in the discovery set and validation set were shown via the receiver-operating characteristic (ROC) curves for comparison between (a,d) normal control versus ovarian tumors, (b,e) benign versus malignant (borderline + malignant), (c,f) borderline versus malignant ovarian tumors. The prediction accuracies by the biomarkers in the discovery set and validation set were compared between (g) normal control versus ovarian tumor, (h) benign versus malignant (borderline + malignant), (i) borderline versus malignant ovarian tumor. AUC = area under the curve. Red line indicates biomarker panel. blue line indicates CA125. Green line indicates the hybrid model based on biomarker panel and CA125.

