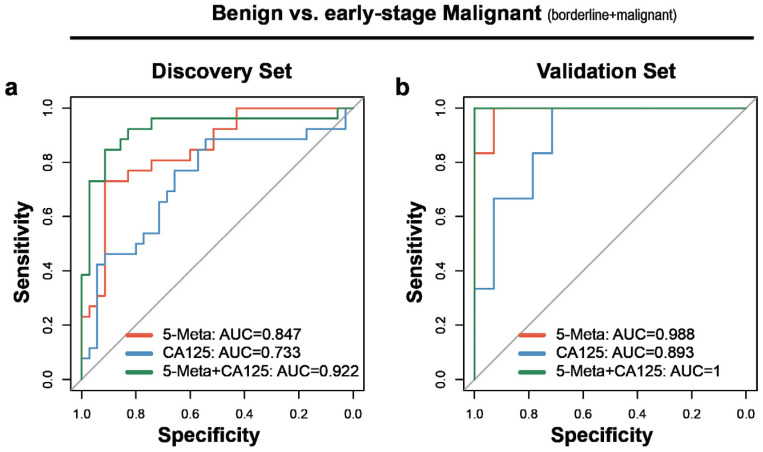
Figure 5.
Early-stage diagnostic performance of biomarkers between benign and malignant ovarian tumors in plasma samples. (a) The ROC (receiver operating characteristic) curves for comparison between benign versus early-stage ovarian cancer in the discovery set. (b) The ROC curves for comparison between benign versus early-stage ovarian cancer in the validation set. AUC = area under the curve. Red line indicates biomarker panel. blue line indicates CA125. Green line indicates the hybrid model based on biomarker panel and CA125.

