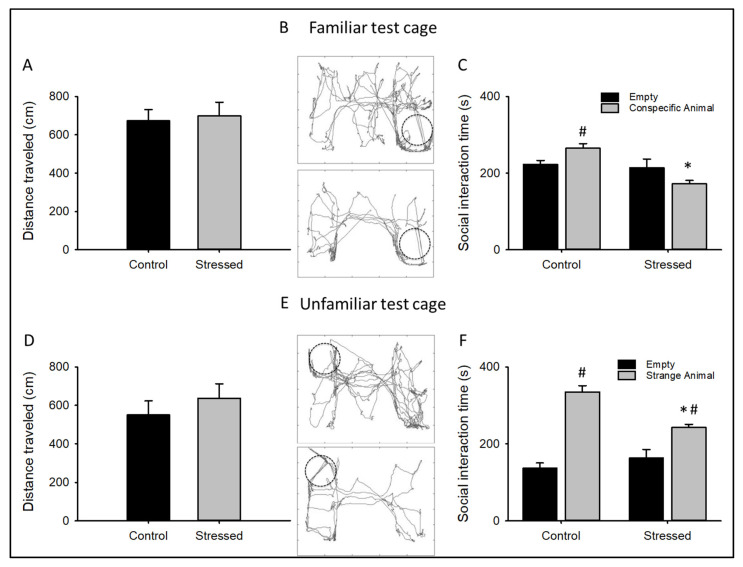
Figure 2.
Chronic restraint stress affects the social interaction in rats: Graph plots showing the total distance traveled during the first exploration (A) or the time that each animal spent interacting with a familiar animal (C), the representative trajectory path of a control animal (up) or after three weeks of CRS protocol (down) in the interaction arena with a familiar animal is shown in (B). Graph plots showing the total distance traveled during the second exploration (D) or the time that each animal spent interacting with an unfamiliar animal (F), the representative trajectory path of a control animal (up) or after three weeks of CRS protocol (down) in the interaction arena with an unfamiliar animal is shown in (E). Bar graphs are mean ± SEM. n = 15 * p value < 0.05 between CRS-subjected animals and control; # p value < 0.05 when compared with the empty compartment.

