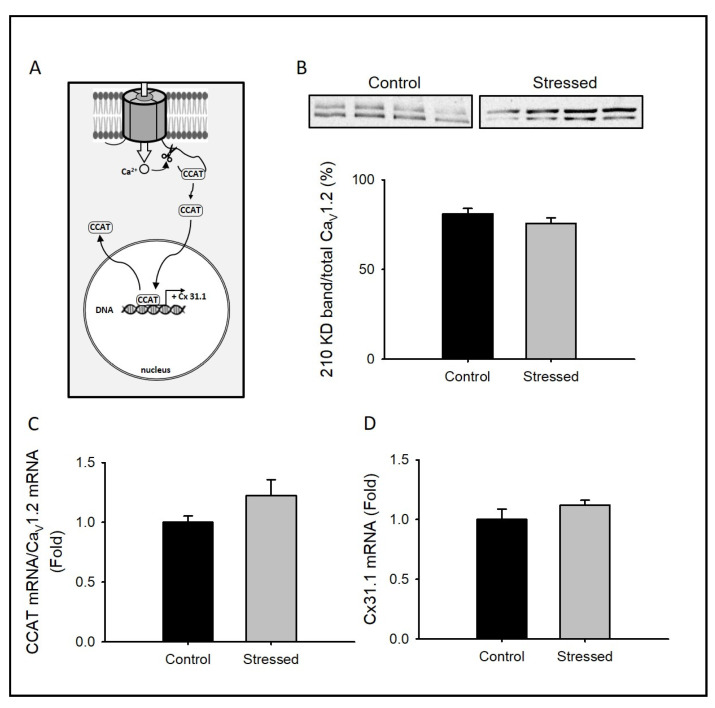
Figure 5.
Calcium channel associated transcriptional regulator (CCAT)-dependent signaling in CRS-subjected animals: (A) Schematic diagram depicting the signaling pathway studied in this figure (B) Bar graph of 210 kD Cav1.2 protein expression normalized to total Cav1.2 protein expression (210 kD + 240 kD) from whole hippocampus lysates (n = 8), in the upper part, a representative immunoblot showing Cav1.2 protein expression is shown. Bar graph of semi-quantitative PCR expression for the CCAT mRNA normalized to the Cav1.2 mRNA (C) or Cx31.1 mRNA (D) isolated from whole hippocampus of juvenile rat controls (n = 8) or subjected to CRS for 3 weeks (n = 8). Bar graphs are mean ± SEM; black bars are control animals, and gray bars correspond to CRS-subjected animals.

