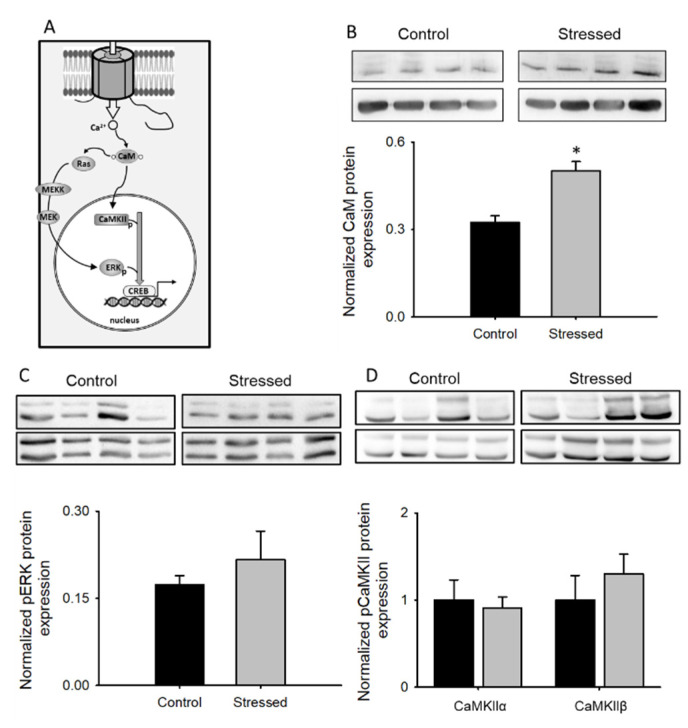
Figure 6.
CaM-dependent signaling in CRS-subjected animals: (A) Schematic diagram depicting the signaling pathway studied in this figure. (B) Bar graph of CaM protein expression from whole hippocampus lysates normalized to α-tubulin (n = 8), in the upper part, a representative immunoblot showing CaM and α-tubulin protein expression is shown. Bar graph of pERK (C, n = 8), pCaMKII (D, n = 8) expression from whole hippocampus lysates normalized to the total respective protein. Representative Western blots for pERK, pCaMKII, as well as total ERK and CaMKII are shown in the upper part of each bar graph. Bar graphs are mean ± SEM; black bars are control animals, and gray bars correspond to CRS-subjected animals * p value < 0.05.

